2022-9-5 06:18 |
Bitcoin is struggling to settle above $20,500 against the US Dollar. BTC could decline heavily if there is a clear move below the $19,500 support zone.
Bitcoin is stuck near the $20,000 zone and trading below the $20,500 resistance. The price is now trading below the $20,000 level and the 100 hourly simple moving average. There is a short-term rising channel forming with support near $19,750 on the hourly chart of the BTC/USD pair (data feed from Kraken). The pair could accelerate lower if there is a clear move below the $19,600 and $19,500 levels. Bitcoin Price Remains in a RangeBitcoin price traded in a range below the $20,500 and $20,550 resistance levels. BTC failed on many occasions to clear the $20,500 resistance zone.
At the same time, the bulls were active above the $19,500 support zone. The recent low was formed near $19,600 and the price is now moving higher in the range. There was a minor increase above the $19,750 resistance zone. The price climbed above the 23.6% Fib retracement level of the recent decline from the $20,397 swing high to $19,600 low.
Bitcoin price is now trading below the $20,000 level and the 100 hourly simple moving average. There is also a short-term rising channel forming with support near $19,750 on the hourly chart of the BTC/USD pair.
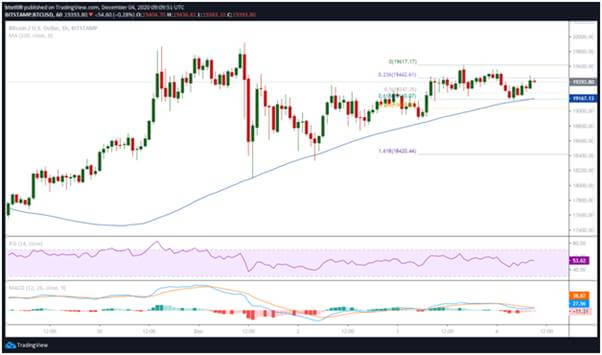
On the upside, an immediate resistance is near the $19,900 level and the 100 hourly simple moving average. The next major resistance sits near the $20,000 level. It is near the 50% Fib retracement level of the recent decline from the $20,397 swing high to $19,600 low.
Source: BTCUSD on TradingView.comA clear move above the $20,000 resistance might send the price towards $20,500. Any more gains might start a steady move towards the $21,200 resistance zone.
Downside Break in BTC?If bitcoin fails to clear the $20,500 resistance zone, it could start another decline. An immediate support on the downside is near the $19,750 zone.
The next major support sits near the $19,600 level. The main support sits near the $19,500 level. A break below the $19,500 support might spark a sharp decline towards $18,800. Any more losses might call for a move to $18,500 in the near term.
Technical indicators:
Hourly MACD – The MACD is now losing pace in the bullish zone.
Hourly RSI (Relative Strength Index) – The RSI for BTC/USD is now above the 50 level.
Major Support Levels – $19,750, followed by $19,500.
Major Resistance Levels – $20,000, $20,350 and $20,500.
origin »Bitcoin price in Telegram @btc_price_every_hour
Bitcoin (BTC) на Currencies.ru
|
|