2023-2-24 06:11 |
Bitcoin price is struggling to clear the $24,500 resistance zone. BTC must clear the $24,500 resistance and the 100 hourly SMA to start a decent increase.
Bitcoin is still struggling to clear the $24,500 resistance zone. The price is trading below $24,500 and the 100 hourly simple moving average. There is a new bearish trend line forming with resistance near $24,120 on the hourly chart of the BTC/USD pair (data feed from Kraken). The pair could rise steadily if it clears the 100 hourly SMA and $24,500. Bitcoin Price Consolidates Below $24,500Bitcoin price attempted a fresh increase above the $24,200 resistance. BTC even spiked above the $24,500 resistance zone the 100 hourly simple moving average.
However, there was no upside continuation above $24,500. A high was formed near $24,602 and the price declined again. There was a sharp decline below $24,000 and the price retested the $23,600 support zone. A low is formed near $23,615 and the price is now consolidating.
Bitcoin price trading below $24,500 and the 100 hourly simple moving average. There is also a new bearish trend line forming with resistance near $24,120 on the hourly chart of the BTC/USD pair.
An immediate resistance is near the trend line zone and $24,100. It is near the 50% Fib retracement level of the recent decline from the $24,602 swing high to $23,615 low. The first major resistance is still near the $24,500 zone and the 100 hourly simple moving average.
The next major resistance might $24,840 or the 1.236 Fib extension level of the recent decline from the $24,602 swing high to $23,615 low. A clear move above the $24,840 resistance might send the price towards the key $25,000 resistance zone.
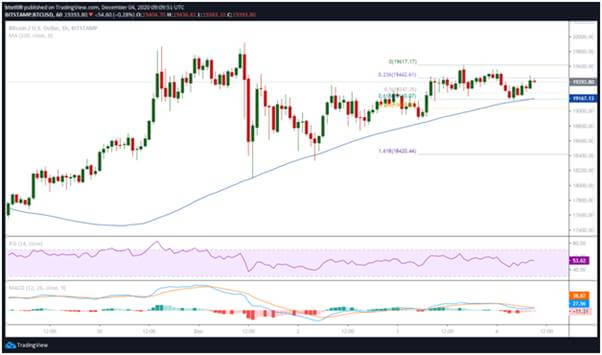
Source: BTCUSD on TradingView.com
A close above the $25,000 resistance could set the pace for a decent increase. In the stated case, the price may perhaps rise towards the $26,200 level.
More Losses in BTC?If bitcoin price fails to clear the $24,500 resistance, it could continue to move down. An immediate support on the downside is near the $23,600 zone.
The next major support is near the $23,500 zone. If there is a downside break, the price might decline towards $22,000. The next major support is near the $21,500 level.
Technical indicators:
Hourly MACD – The MACD is now losing pace in the bullish zone.
Hourly RSI (Relative Strength Index) – The RSI for BTC/USD is now below the 50 level.
Major Support Levels – $23,600, followed by $23,500.
Major Resistance Levels – $24,120, $24,500 and $25,000.
origin »Bitcoin price in Telegram @btc_price_every_hour
Resistance (RES) на Currencies.ru
|
|