2021-12-20 06:28 |
Bitcoin failed to clear the $48,500 resistance zone against the US Dollar. BTC is sliding, but it could find bids near the $45,500 support zone.
Bitcoin is facing a strong resistance near the $48,000 and $48,500 levels. The price is now trading below $48,000 and the 100 hourly simple moving average. There is a major bearish trend line forming with resistance near $47,200 on the hourly chart of the BTC/USD pair (data feed from Kraken). The pair could decline heavily if there is a clear break below the $45,500 support zone. Bitcoin Price Faces Resistance Near $48,500Bitcoin price started a recovery wave above the $46,500 resistance zone. BTC surpassed the $48,000 level, but it failed to gain strength above the $48,200 level.
A high was formed near $48,289 and the price is now correcting lower. It traded below the 50% Fib retracement level of the upward move from the $45,520 swing low to $48,289 high. Bitcoin price is now trading below $48,000 and the 100 hourly simple moving average.
An immediate resistance on the upside is near the $47,000 level. The first major resistance is near the $47,200 level and the 100 hourly SMA. There is also a major bearish trend line forming with resistance near $47,200 on the hourly chart of the BTC/USD pair.
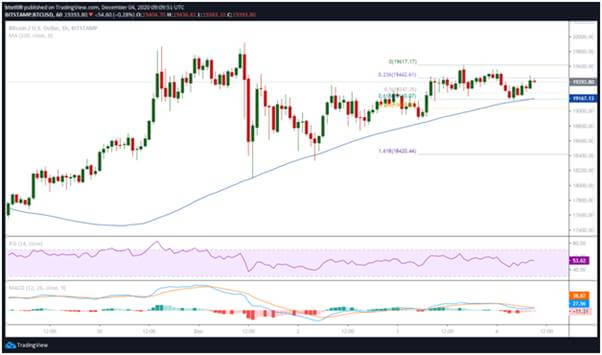
Source: BTCUSD on TradingView.comThe next key resistance could be $47,500, above which the price might rise towards the $48,500 resistance. To continue higher, the price must gain strength for a move above the $48,500 level in the near term.
Dips Limited In BTC?If bitcoin fails to clear the $47,500 resistance zone, it could extend decline. An immediate support on the downside is near the $46,500 level.
The 61.8% Fib retracement level of the upward move from the $45,520 swing low to $48,289 high is also near the $46,500 level. A downside break below the $46,500 level could push the price towards the $45,500 support. The next major support is near $45,000, below which there is a risk of a sharp decline towards the $43,200 level.
Technical indicators:
Hourly MACD – The MACD is slowly gaining pace in the bearish zone.
Hourly RSI (Relative Strength Index) – The RSI for BTC/USD is currently below the 50 level.
Major Support Levels – $46,500, followed by $45,500.
Major Resistance Levels – $47,200, $47,500 and $48,500.
origin »Bitcoin price in Telegram @btc_price_every_hour
Bitcoin (BTC) на Currencies.ru
|
|