2019-2-14 14:09 |
Long-Term Outlook Litecoin Weekly Chart – Source: Tradingview.com
A look at the Weekly chart for Litecoin shows that the price of LTC/USD has found resistance at the major resistance area formed by previous support near $50, and started a small retracement.
It is currently trading at $42. It is worth noting that the highest weekly volume occurred at the two weekly bullish engulfing candles.
The major support area is found at $26-$29.
The RSI is at 42, indicating neither overbought nor oversold conditions.
After a long period of bullish divergence, the MACD is moving upward with strength but is not positive yet.
Medium-Term Outlook Litecoin 3-Day Chart – Source: Tradingview.comA look at the 3-day chart shows that the resistance coincided with the edge of the Ichimoku cloud.
The volume pattern found in the weekly chart is also present in the 3-day one, the highest volume being recorded on bullish candles.
The MACD is moving upward with strength and has turned positive.
Furthermore, the 21 and 50-period moving averages are close to making a bullish cross.
Litecoin Daily Chart – Source: Tradingview.comA look at the Daily chart gives us three minor support areas which could hold price.
The first one was found by the mid-January top near $42, where price is currently trading. The second and third ones were found near $35 and $29 respectively.
However, the price seems to have found resistance at the 200-day moving average.
Finally, it is worth keeping an eye on whether the MACD makes a bearish cross or rejects it and keeps moving upward.
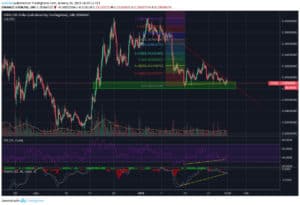
Short-Term Outlook and Price Prediction Litecoin 4-Hour Chart – Source: Tradingview.comA look at the 4-hour chart finally gives us a structure in which price is trading in.
Price has been moving in a descending wedge (bullish pattern) since it reached the $48 top on February 11.
The drop in price was preceded by bearish divergence in both the RSI and the MACD. Furthermore, the MACD has just turned negative.
There is no bullish divergence yet.
Litecoin Price Prediction:I believe that price will break out of the descending wedge and head for the resistance provided by the 0.5 and 0.618 fib ratios near $45.
Conclusions: Price has found resistance at the 200-day moving average. The drop in price was preceded by medium-term bearish divergence. Price is moving in a short-term descending wedge. Latest Litecoin News:Litecoin [LTC] Price Action – Support Met at January High
Litecoin Lightning Network Transactions Go Live on CoinGate
DISCLAIMER: Investing or trading in digital assets, such as those featured here, is extremely speculative and carries substantial risk. This analysis should not be considered investment advice, use it for informational purposes only. Historical performance of the assets discussed is not indicative of future performance. Statements, analysis, and information on blokt and associated or linked sites do not necessarily match the opinion of blokt. This analysis should not be interpreted as advice to buy, sell or hold and should not be taken as an endorsement or recommendation of a particular asset.Litecoin Price Prediction: LTC Found Support at the Recent High, Is It Heading for the $48 Top Again? was originally found on Cryptocurrency News | Blockchain News | Bitcoin News | blokt.com.
origin »Bitcoin price in Telegram @btc_price_every_hour
Litecoin (LTC) на Currencies.ru
|
|