2021-3-21 15:29 |
The Chainlink (LINK) price has been increasing since bouncing on Feb. 23.
LINK is expected to continue increasing towards $35 and potentially break out.
Long-Term OutlookOn Feb. 20, the altcoin reached a new all-time high of $36.93. However, it dropped sharply almost immediately afterwards, reaching a low of $20.80 three days later. It has been moving upwards since.
Technical indicators in the weekly time-frame are bullish. The RSI has generated hidden bullish divergence. The MACD is increasing, and so is the Stochastic oscillator. Furthermore, the latter has already made a bullish cross.
If the altcoin reaches a new all-time high price, the next resistance areas would be found at $41, $54 and $67.
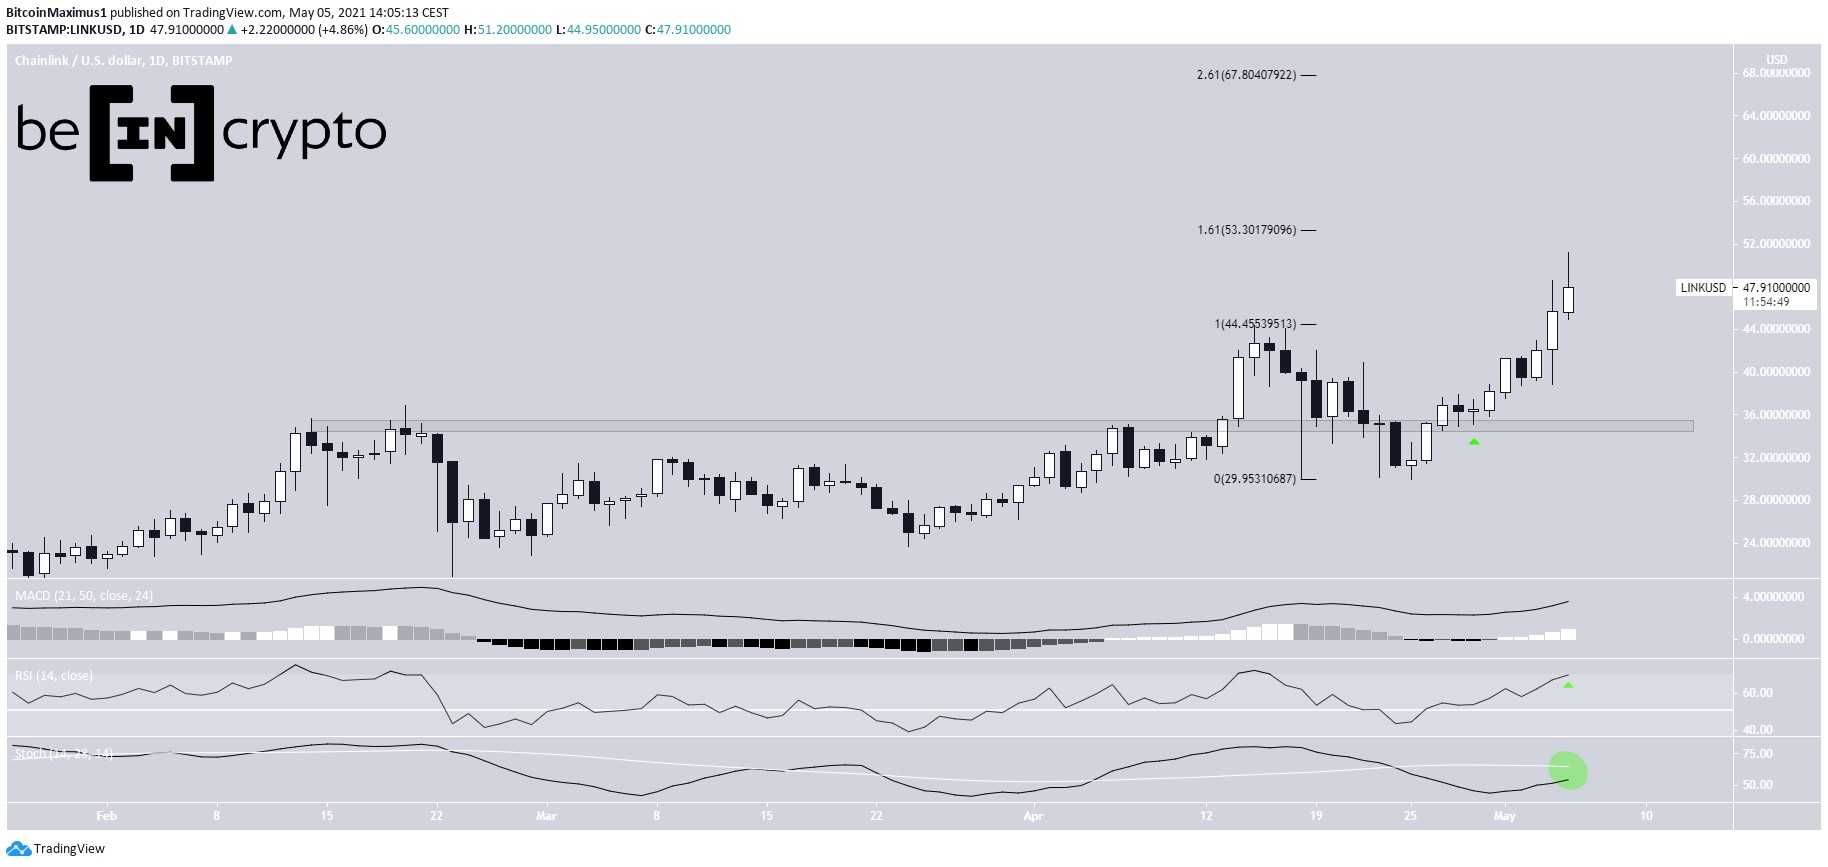
LINK Chart By TradingView Ongoing LINK BreakoutThe daily chart shows that the price is approaching the all-time high resistance area of $35.
Similar to the weekly time-frame, technical indicators in the daily time-frame are bullish. The MACD has given a bullish reversal signal. The RSI has crossed above 50. The Stochastic oscillator has made a bullish cross.
In addition, using an external retracement on the most recent drop gives us another resistance area, which is found at $46.
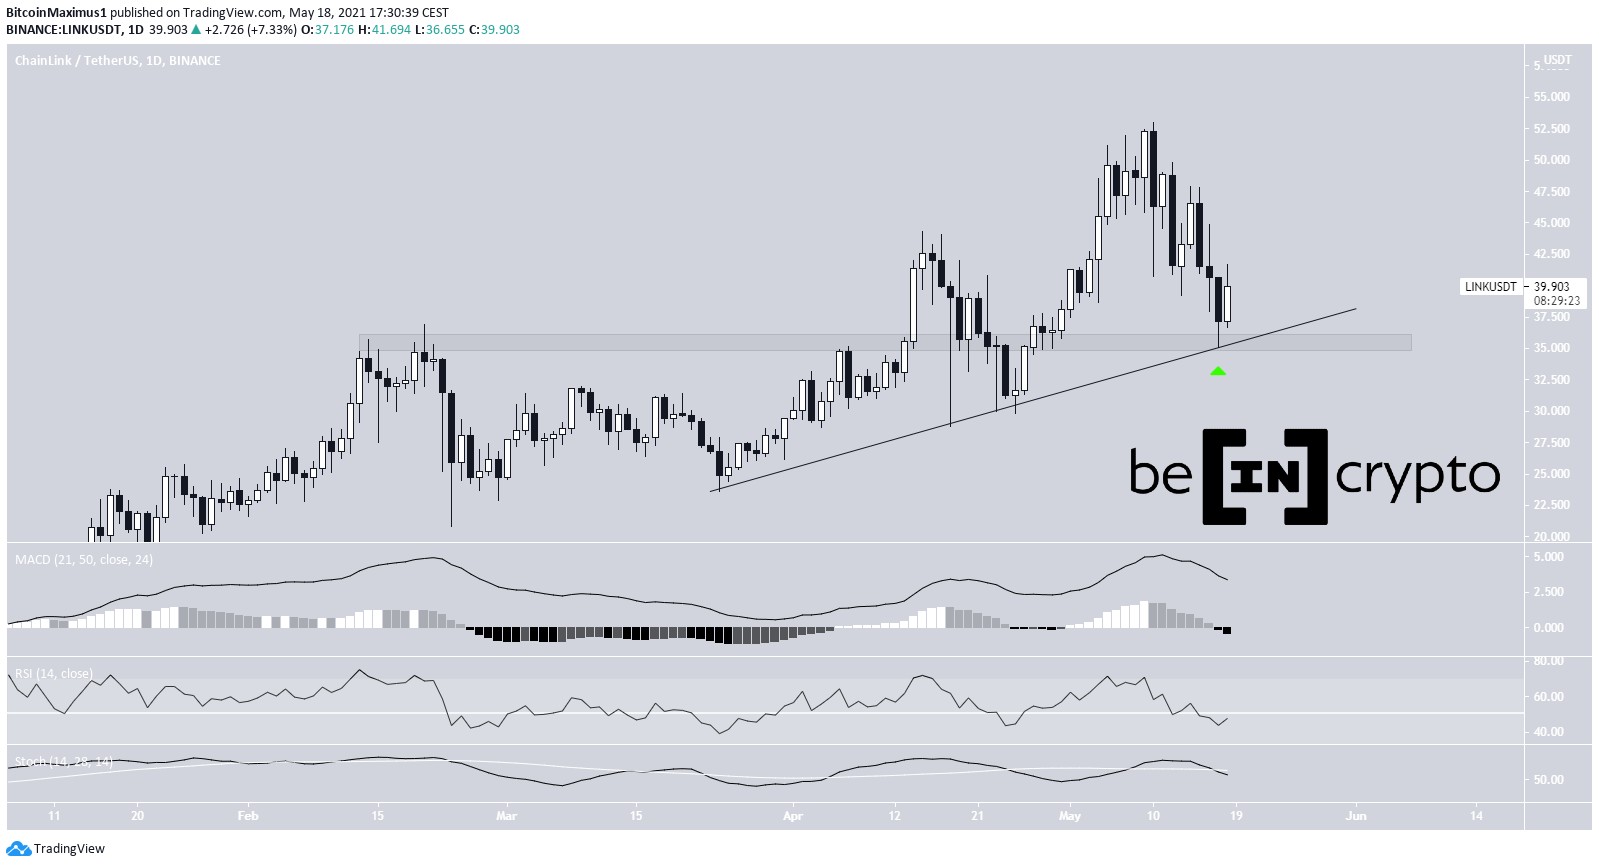
LINK Chart By TradingViewCryptocurrency trader @Dlinkbull outlined a LINK chart which shows a breakout from a descending resistance line.
Source: TwitterIndeed, the altcoin has broken out from a descending resistance line, and validated it as support afterwards.
Therefore, the token is expected to continue increasing towards the $35 resistance and potentially break out.
LINK Chart By TradingView LINK/BTCLINK/BTC has been following a descending resistance line since the beginning of Sept. 2020. So far, it has made five unsuccessful breakout attempts.
On March 15, the token reached the 48,000 satoshi support area and bounced. The bounce is expected to take the price to the descending resistance line once more. If it breaks out, the next resistance area would be found at 82,500 satoshis.
Technical indicators are mixed. While the MACD is bullish, the Stochastic oscillator is bearish. In any case, a RSI move above 50, which seems likely, would go a long way in indicating that the trend is bullish.
LINK Chart By TradingView ConclusionTo conclude, LINK/USD is expected to increase towards $35 and potentially break out.
LINK/BTC is expected to resume the ongoing bounce. Eventually, a breakout from the descending resistance line is expected.
For BeInCrypto’s latest Bitcoin (BTC) analysis, click here.
The post LINK Bounces And Aims For All-Time High Resistance appeared first on BeInCrypto.
origin »Bitcoin price in Telegram @btc_price_every_hour
High Voltage (HVCO) на Currencies.ru
|
|