2022-5-3 18:30 |
Be[in]Crypto takes a look at the price movement for seven different cryptocurrencies, including ApeCoin (APE), which is scrambling for support after a 45% drop since its all-time high.
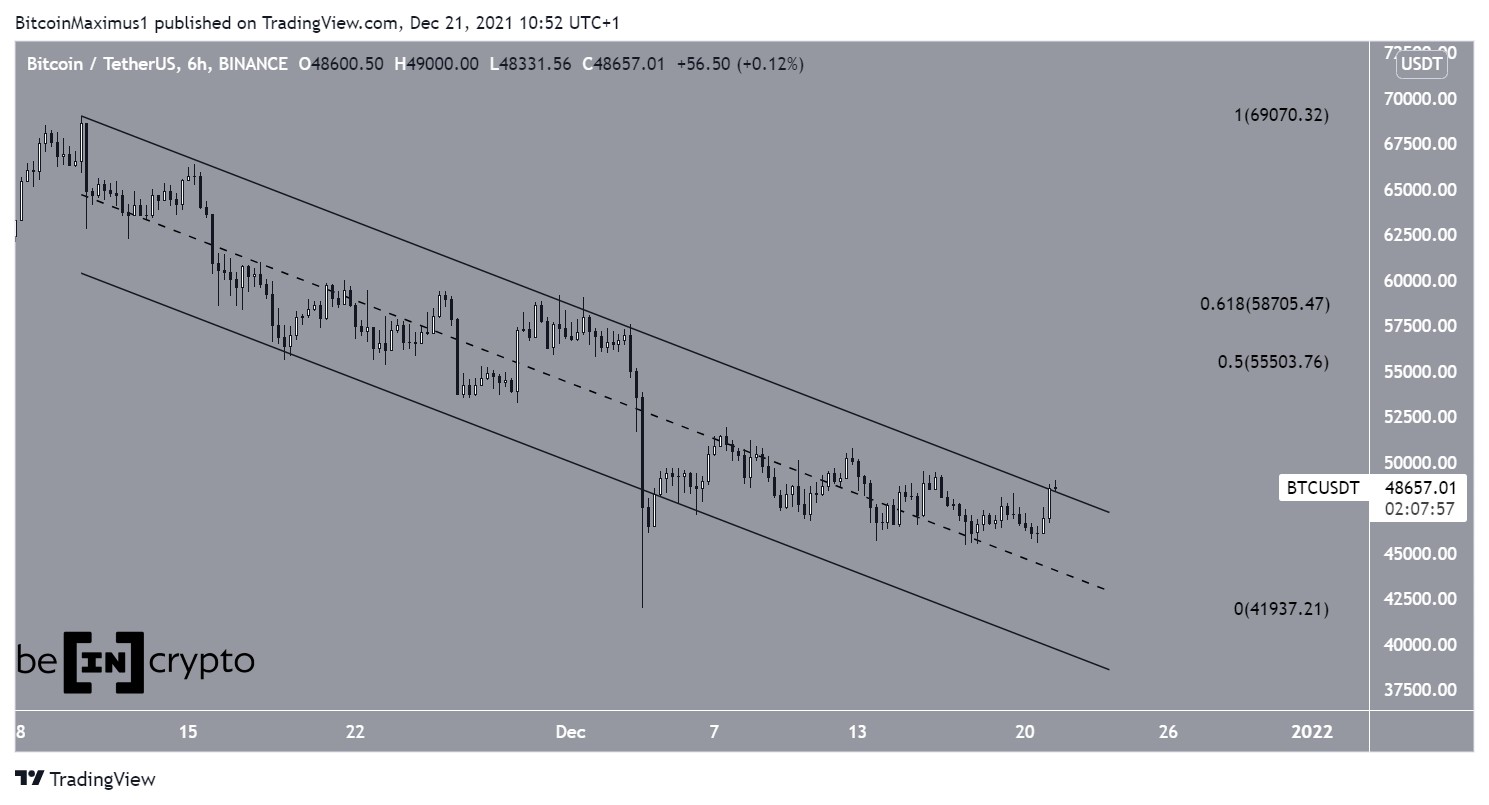
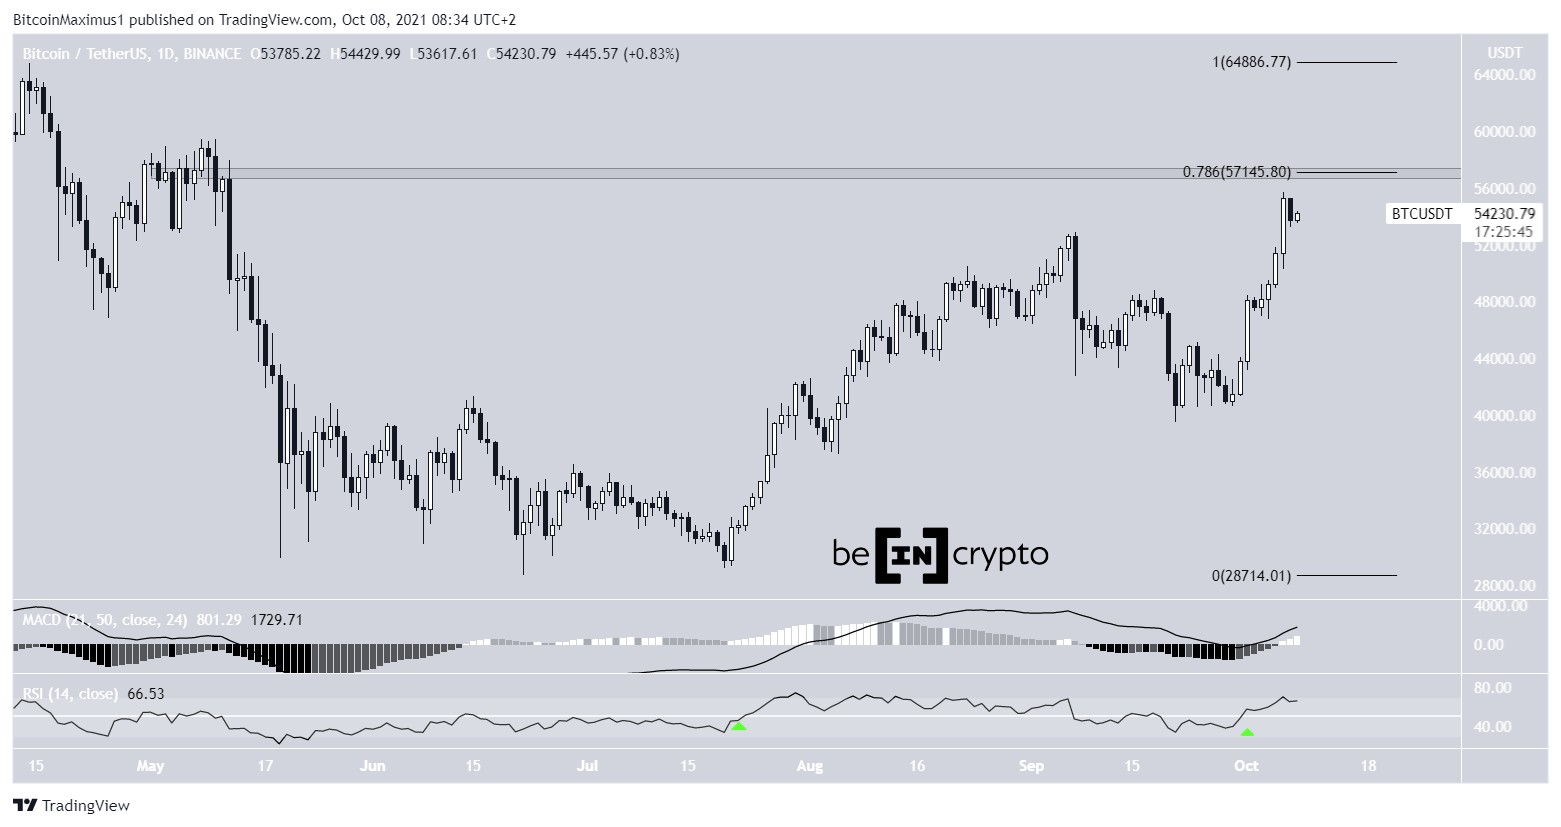
BTCBTC has been falling since reaching a high of $48,189 on March 28. The downward movement continued until a low of $37,386 was reached on May 1. The ensuing bounce validated the $37,800 horizontal area as support.
Additionally, the price has been decreasing underneath a descending wedge since April 19. The descending wedge is considered a bullish pattern, meaning that breaking from it would be the most likely scenario.
If one occurs, the closest resistance area would be at $42,800. This is the 0.5 Fib retracement resistance level and the top of the wedge.
Chart By TradingView ETHETH has been decreasing since April 3. The decrease was initially swift, but ETH has been decreasing much more gradually since April 11, trading inside a descending parallel channel.
The channel is considered a corrective pattern, meaning that a breakout from it would be the most likely scenario.
On April 30 (green icon), ETH bounced at the $2,750 horizontal support area and the support line of the channel. It is currently attempting to reclaim the middle of the channel.
If a breakout occurs, the next closest resistance area would be at $3,150.
Chart By TradingView XRPSimilar to BTC, XRP has been falling since March 28. The downward movement led to a low of $0.566 on April 30. The ensuing bounce (green icon) served to validate the $0.56 horizontal area as support. This is a crucial area since it is the final support level prior to new yearly lows.
If the area initiates a bounce, the next closest resistance would be at $0.70.
Chart By TradingView APEAPE has been decreasing since reaching an all-time high price of $27.60 on April 28. So far, it has decreased by 45%.
On May 2, it reached a low of $14.20 and bounced slightly. The bounce served to validate the previous all-time high resistance at $14.50 as support.
A breakdown below this level would indicate that the current structure is bearish.
Chart By TradingView 1INCH1INCH has been decreasing alongside a descending support line since May 23. So far, it has reached a low of $1.07 on April 30.
On April 25, 1INCH broke down below the $1.30 horizontal support area. Additionally, the RSI broke its bullish divergence trendline (green line).
Until this area is reclaimed, the trend cannot be considered bullish.
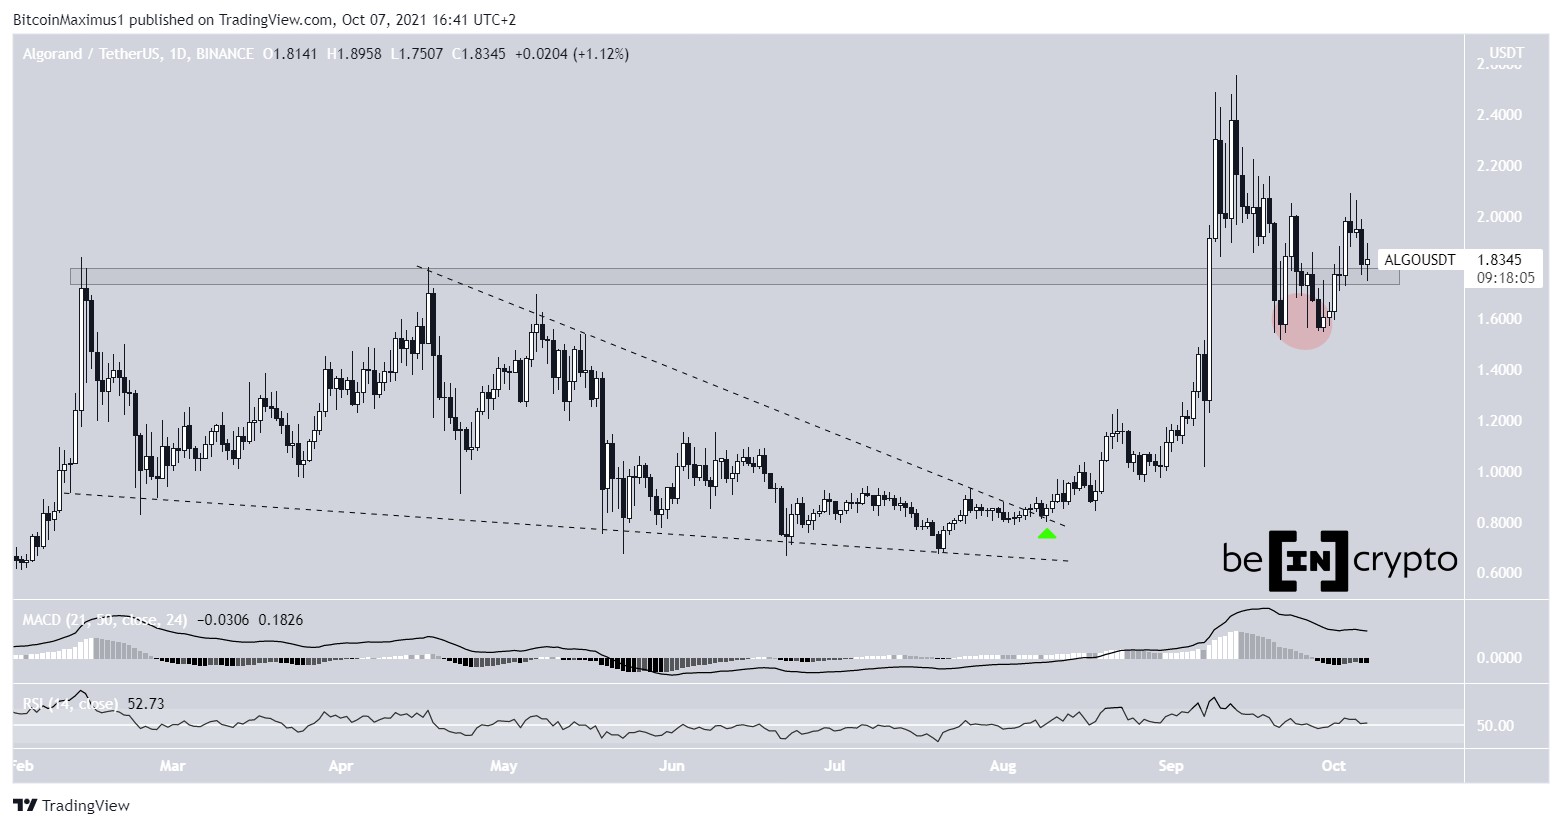
Chart By TradingView ALGOSince Feb 24, Algorand (ALGO) has bounced thrice (green icons) above the $0.70 horizontal support area. However, it was unsuccessful in initiating a reversal and broke down on April 28.
Currently, it is making an attempt (red icon) at reclaiming this horizontal level. Whether it is successful in doing so or gets rejected will likely determine the direction of the future trend.
Chart By TradingView IOTASince May 2021, IOTA has bounced at the $0.70 horizontal area five times. However, it failed to initiate an upward movement and broke down below the area on April 2022.
Until this area is reclaimed, the trend cannot be considered bullish.
Chart By TradingViewFor Be[in]Crypto’s previous Bitcoin (BTC) analysis, click here
The post ApeCoin (APE) Rebounds At Previous All-Time High Resistance: Multi-Coin Analysis appeared first on BeInCrypto.
origin »Bitcoin price in Telegram @btc_price_every_hour
High Voltage (HVCO) на Currencies.ru
|
|