2021-10-20 11:32 |
Bitcoin (BTC) is nearing the $64,854 all-time high price and has so far reached a local high only $400 below it. While the long-term trend is still clearly bullish, there are signs of weakness in short-term time frames.
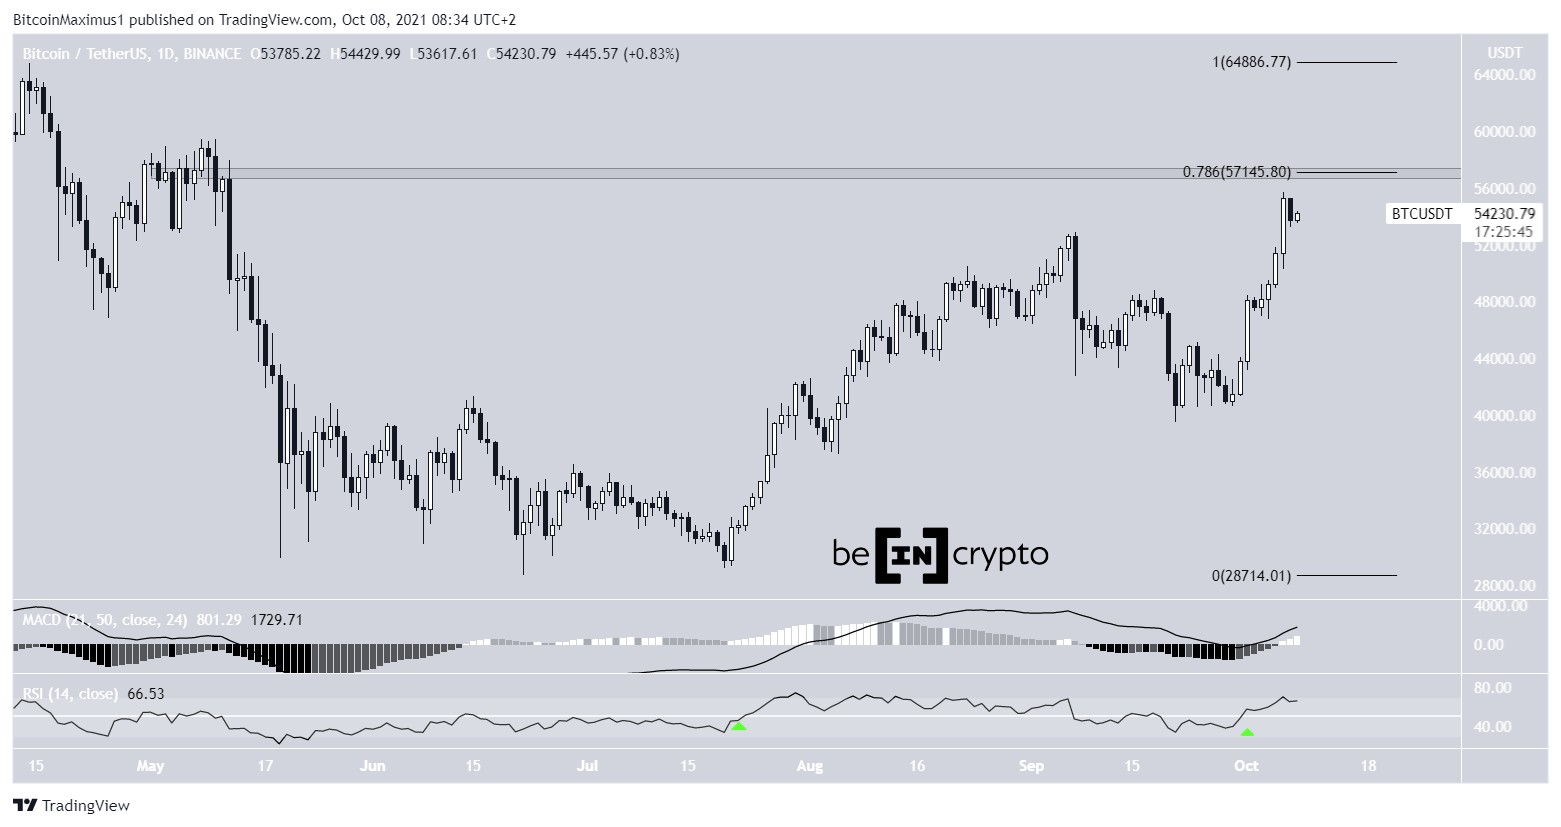
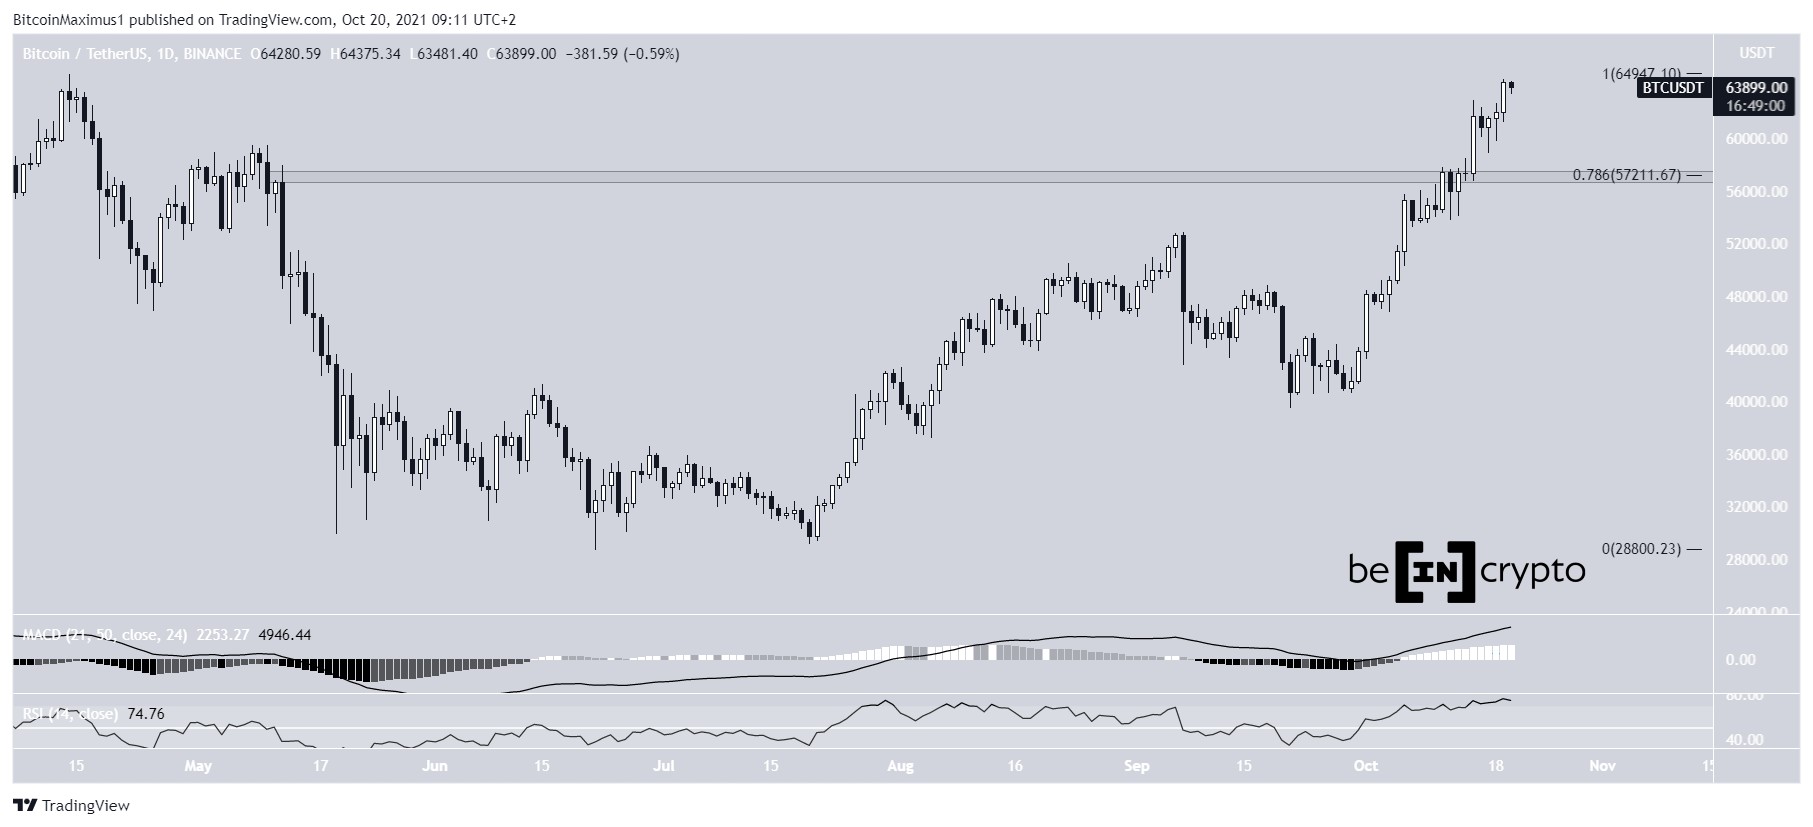
The daily chart shows a bullish trend for BTC. On Oct 14, it broke out from the $57,200 resistance area. This is the final resistance area prior to a new all-time high. It has been moving upwards at an accelerated rate since.
So far, BTC has reached a high of $64,486, on Oct 19. This is just slightly less than $400 below the current all-time high price of $64,854.
Technical indicators in the daily time frame are also bullish.
The MACD, which is created by short and long-term moving average (MA), is positive and increasing. This means that the short-term trend is moving faster than the long-term trend. This is a positive sign in bullish trends.
The RSI, which is a momentum indicator, is increasing and is above 70. This is also a sign of positive momentum in a bullish trend and supports the continuation of the upward movement.
Therefore, the daily time frame suggests that a breakout will transpire and BTC will reach a new all-time high price.
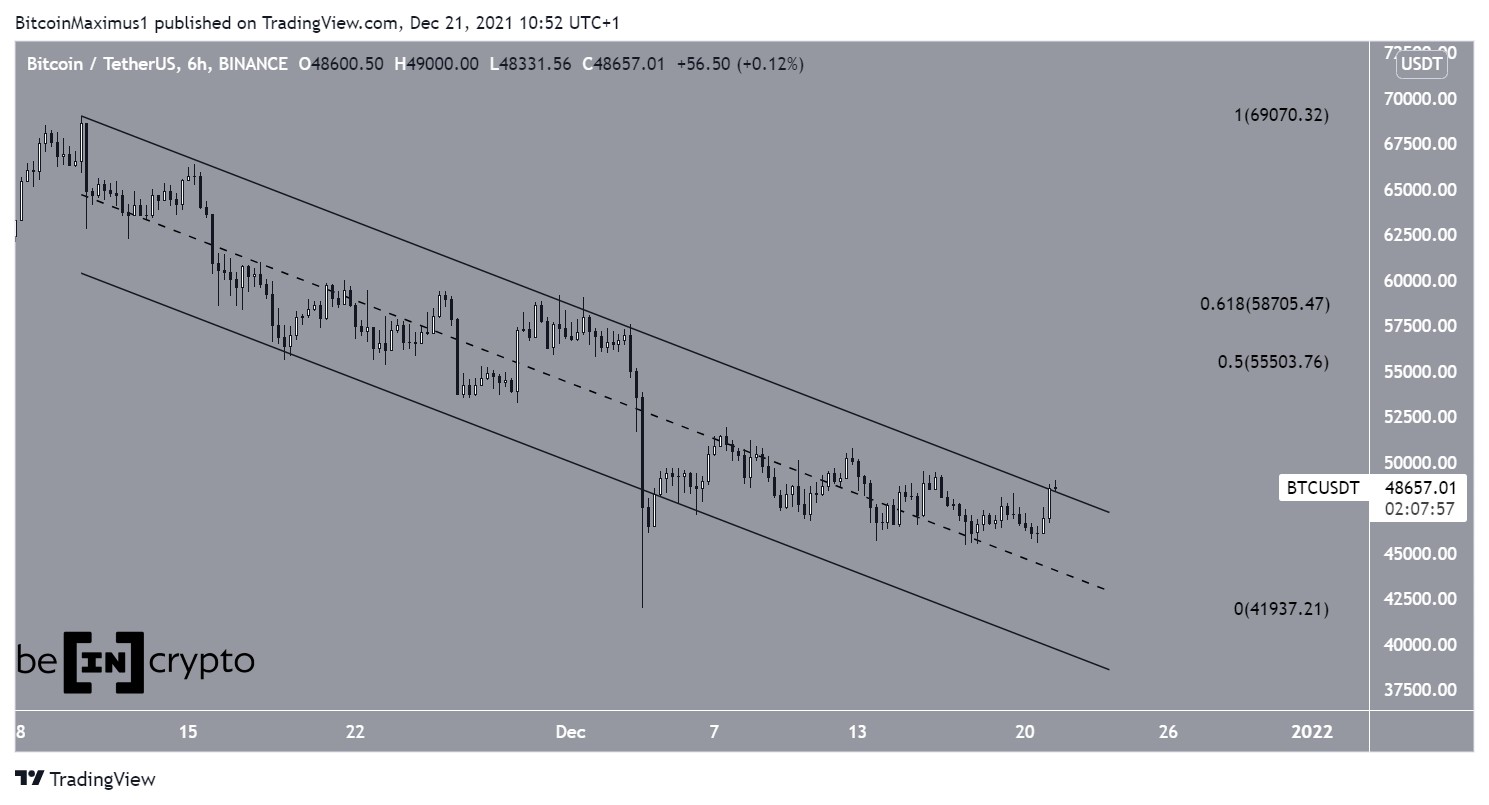
BTC Chart By TradingView Future movementThe six-hour chart shows that BTC has broken out from an ascending parallel channel and bounced at its resistance line after (green icon). This suggests that the resistance line is now likely to act as support.
However, unlike the daily time frame, there are signs of weakness developing, since both the RSI and MACD have generated bearish divergences. This means that the increase in price has not been accompanied by a similar increase in momentum, and could lead to a pullback.
BTC Chart By TradingViewA similar outlook is given by the two-hour chart, which shows even more pronounced bearish divergences.
BTC Chart By TradingView BTC wave countThe wave count shows that BTC is in the fifth and final wave of a bullish impulse (black). This means that after the current upward move is completed, a corrective period is likely.
BTC is currently inside the first likely area that could act as the top. This area is created by the 1.61 length of wave one (white) and the 0.618 length of waves 1-3 (black).
If the movement extends, the next level that could act as the top is between $69,000-$70,000. This range is created by the 2.61 length of wave one (white) and the 1:1 length of waves 1-3 (black).
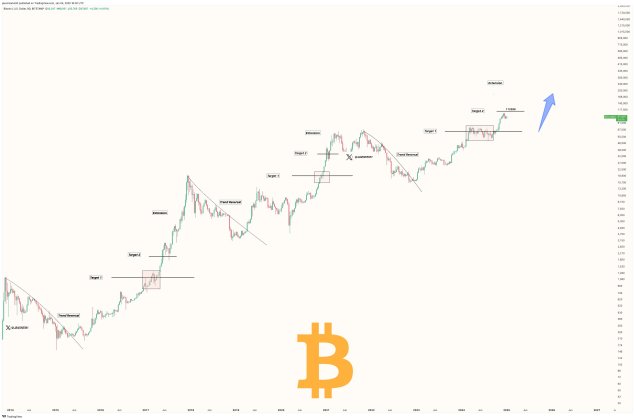
BTC Chart By TradingViewAs for the long-term count, BTC also seems to be in a long-term wave five (red) of a bullish impulse that began in December 2018. Therefore, the upward trend has been in place for nearly three years. The sub-wave count is shown in white.
A preliminary target for the top of this move is between $107,000 and $117,000. This target is found by using an external Fib retracement on wave four (black) and the 1:1.61 length of waves 1-3 (red).
Such Fib retracements are used to find the higher resistance levels when the price is at an all-time high.
BTC Chart By TradingViewFor BeInCrypto’s latest Bitcoin (BTC) analysis, click here.
The post Bitcoin (BTC) Retakes $64,000 in Hunt for New All-Time High appeared first on BeInCrypto.
origin »Bitcoin price in Telegram @btc_price_every_hour
High Voltage (HVCO) на Currencies.ru
|
|