2020-11-27 22:00 |
The XRP price has been falling rapidly since reaching a high of $0.79 on Nov. 24. Despite a sharp drop, XRP should reverse trend near the support levels outlined below and eventually begin to move upwards again.
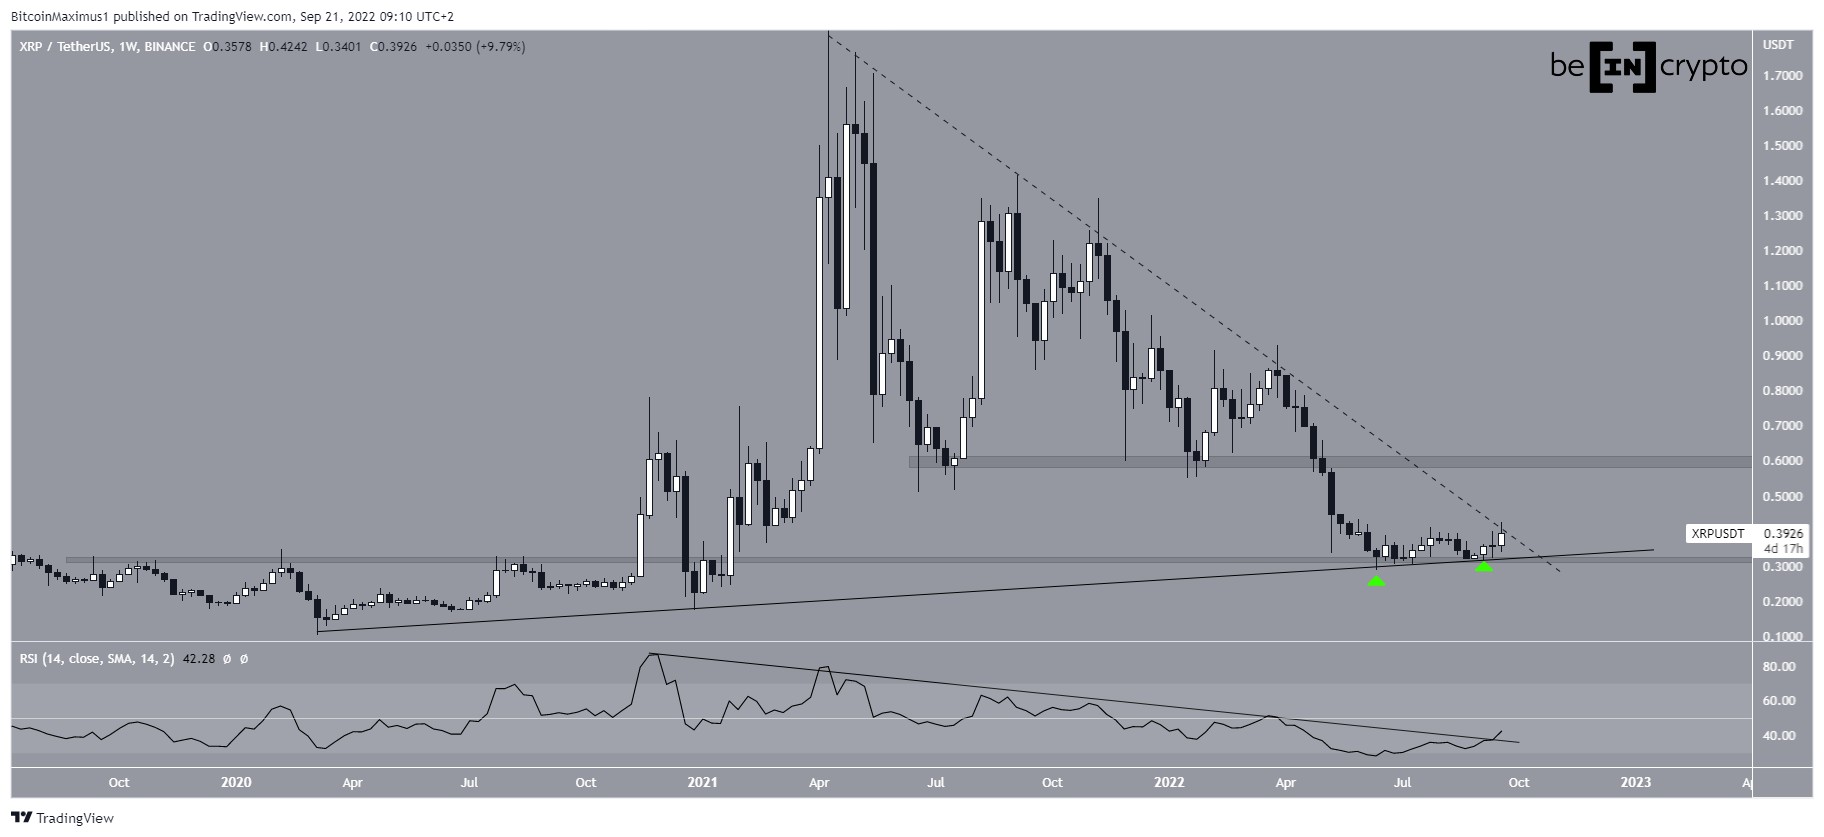
Long-Term MovementThe XRP price has been increasing since it initially broke out from a long-term descending wedge in Jul 2020. However, the price consolidated before the rate of increase intensified during the second week of Nov. It then reached a high of $0.79 on Nov. 24.
Measured from the all-time high price in 2018, the closest significant Fib resistance area is at $1.34, the 0.382 Fib retracement level.
Despite the potential long upper wick in progress, technical indicators on the weekly time-frame are still bullish, supporting the continuation of the upward movement.
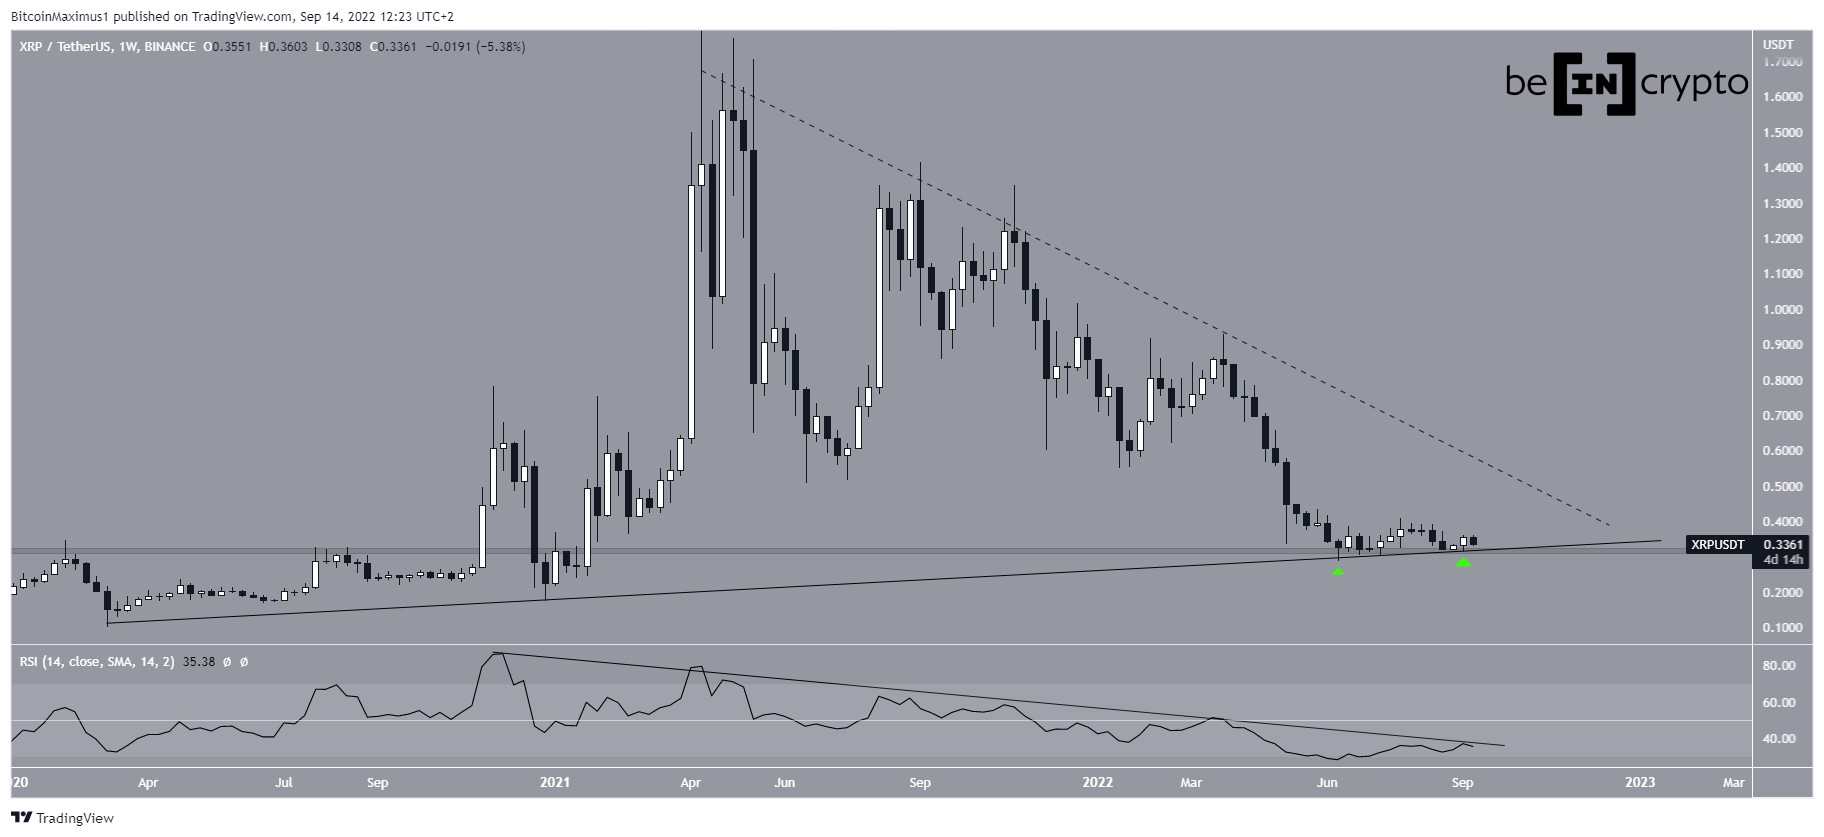
XRP Chart By TradingView Current RallyThe daily chart better shows the move of the past week. In the four days following Nov. 21, the price increased by a massive 153% but has since decreased by nearly 40% in the past two days.
Currently, the price is trading just above the 0.5 Fib retracement level at $0.48, while the 0.618 Fib level is right below at $0.41.
Despite the drop, technical indicators are still bullish.
XRP Chart By TradingViewThe shorter-term two-hour chart shows that the 0.618 Fib retracement level is also a horizontal support area, making it likely to act as a reversal area.
Furthermore, there are no bullish reversal signs in the RSI or the MACD, even though both are oversold. Therefore, it would make sense for the price to continue dropping before eventually resuming its upward trend.
XRP Chart By TradingView Wave CountCryptocurrency trader @TheEWguy outlined an XRP chart, stating that the price is in an extended third wave of a bullish impulse, the completion of which could eventually take the price above $2.
Source: TwitterThe most likely count for XRP suggests that the price began a bullish impulse (shown in white below) with a low reached on March 13, confirmed by the 1/2-1/2 wave formation that followed.
If accurate, the price is now in an extended third wave, currently trading in sub-wave four (orange). Using the extension of sub-wave one, we can find a possible target of $0.92 for the top of the movement.
However, since the target depends on where sub-wave four will end, it’s still only a preliminary target that might not be that accurate.
A decline below the wave one high at $0.33 (red line) would invalidate this particular wave count.
XRP Chart By TradingView Possible BottomThe possibility that the XRP price is in a bullish impulse is strengthened by the fact that the price has broken out from a parallel ascending channel.
The fourth wave often revisits the middle of the channel in what is known as a 4th wave pullback before eventually resuming its upward movement.
The middle of the channel is between two important fib levels at $0.33 – $0.43.
XRP Chart By TradingViewWe can take a closer look at the formation of sub-wave four to narrow the range for the possible bottom. The fourth sub-wave is taking place inside an A-B-C corrective structure (blue).
If the A:C waves have a 1:1.61 ratio, which is common, the price would reach a low of $0.403. Therefore, the $0.403 – $0.433 area is especially likely to act as the bottom.
XRP Chart By TradingView ConclusionTo conclude, the XRP price should reach a bottom between $0.40 and $0.43 before eventually resuming its upward move towards $0.92 and possibly $1.34.
For BeInCrypto’s previous Bitcoin analysis, click here!
Disclaimer: Cryptocurrency trading carries a high level of risk and may not be suitable for all investors. The views expressed in this article do not reflect those of BeInCrypto
The post Despite Drop, XRP’s Bullish Outlook Remains Intact appeared first on BeInCrypto.
origin »Bitcoin price in Telegram @btc_price_every_hour
Ripple (XRP) на Currencies.ru
|
|