2022-7-13 16:00 |
Cardano (ADA) attempted to create several higher lows and a bullish structure after its May 12 bottom. However, it failed to do so and is in the process of breaking down.
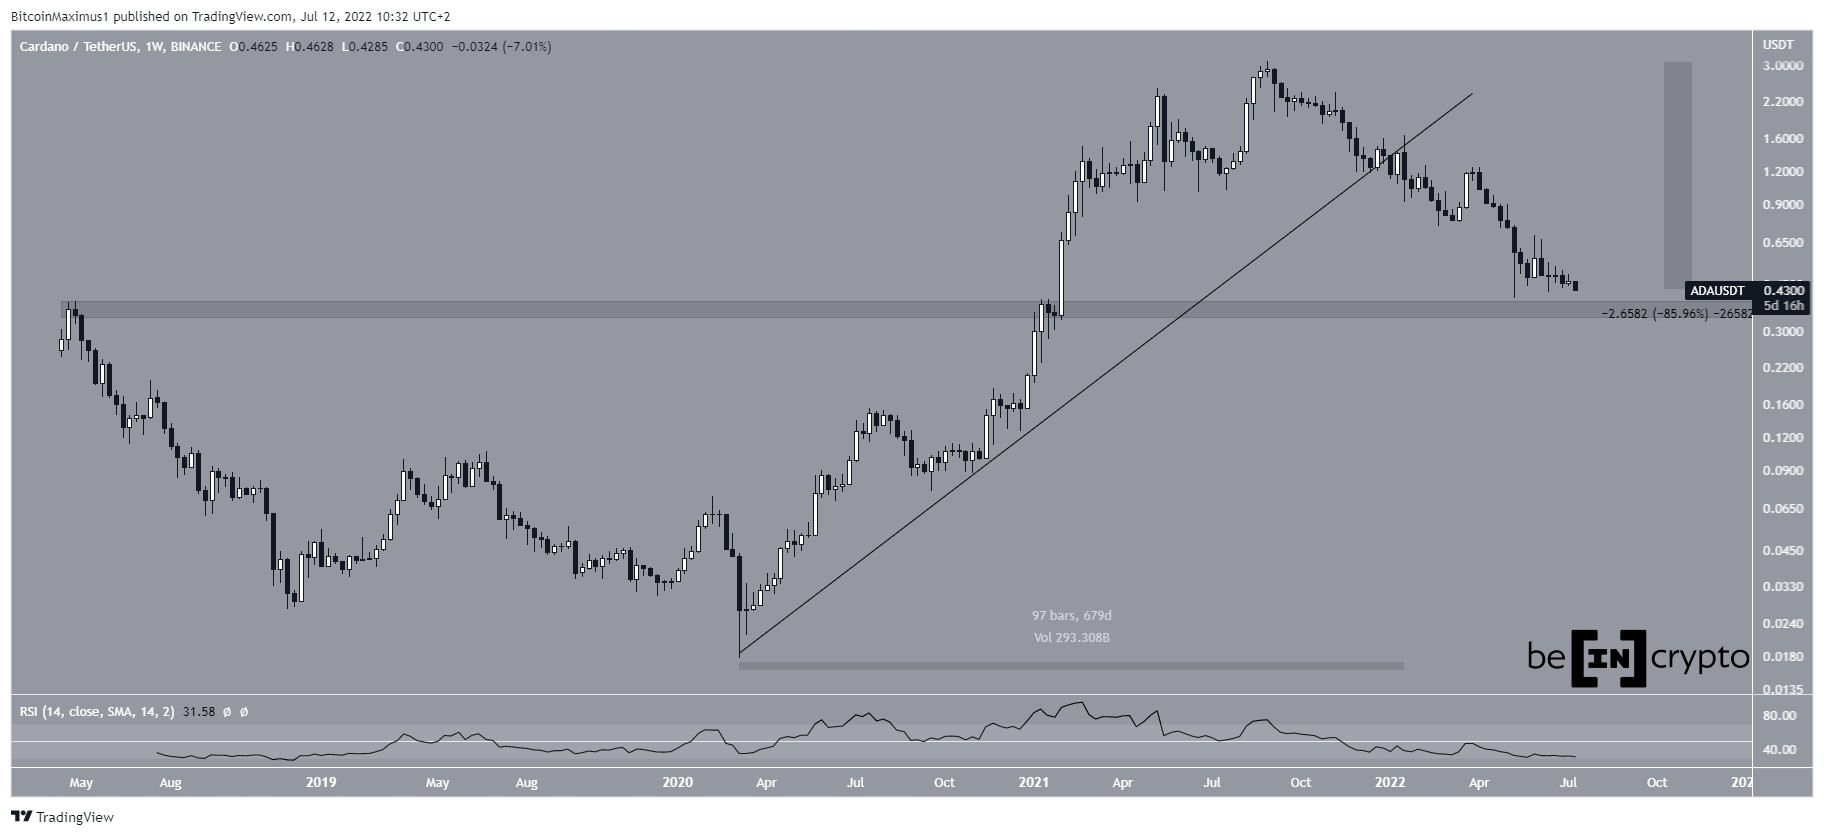
ADA has been falling since reaching an all-time high price of $3.10 on Sept 2. The downward movement has been swift and so far led to a low of $0.40 on May 12. Throughout the decrease, the price broke down from an ascending support line, which had previously been in place for 679 days.
If the downward movement continues, the closest support area would be at $0.36. This is an important horizontal support level since it acted as resistance in May 2018 and then as support in Nov 2020.
Measuring from the high, the price has decreased by 86%.
While the weekly RSI is very close to its oversold territory, it has not reached it yet nor has it generated any bullish divergence.
ADA/USDT Chart By TradingView Potential breakdownCryptocurrency trader @CryptoBullet1 tweeted a chart of ADA, stating that the price has tested the $0.44 area eight times, so it could break down from it.
Source: TwitterThe daily chart does provide a bearish outlook from two main reasons.
Firstly, the RSI has broken down from its bullish divergence trend line (green line). Also, it was rejected by the 50 line (red icon), adding to the bearishness.
Secondly, the price has reached a daily close below the $0.445 horizontal support area.
As a result of these readings, a breakdown and continued descent would be the most likely scenario.
ADA/USDT Chart By TradingView Future ADA movementWhen measuring the most recent portion of the upward movement, the two most likely levels for a bottom to be reached are at $0.32 and $0.23. They are the 1.27 and 1.61 external Fib retracement resistance levels, respectively.
Since the former also coincides with the long-term support area outlined in the first section, it is likely to provide strong support.
ADA/USDT Chart By TradingViewFor Be[in]Crypto’s latest bitcoin (BTC) analysis, click here.
The post Cardano (ADA) Breaks Down Below 60-Day Horizontal Support Area appeared first on BeInCrypto.
origin »Bitcoin price in Telegram @btc_price_every_hour
Cardano (ADA) на Currencies.ru
|
|


