Bitcoin’s YTD performance in danger should this pennant fail

Bitcoin’s YTD performance in danger should this pennant fail
фото показано с : coinjournal.net

2023-4-17 12:09

Bitcoin’s YTD performance exceeds 80% Investors were betting on a pennant formation in March  The 28k level invalidates the bullish formation

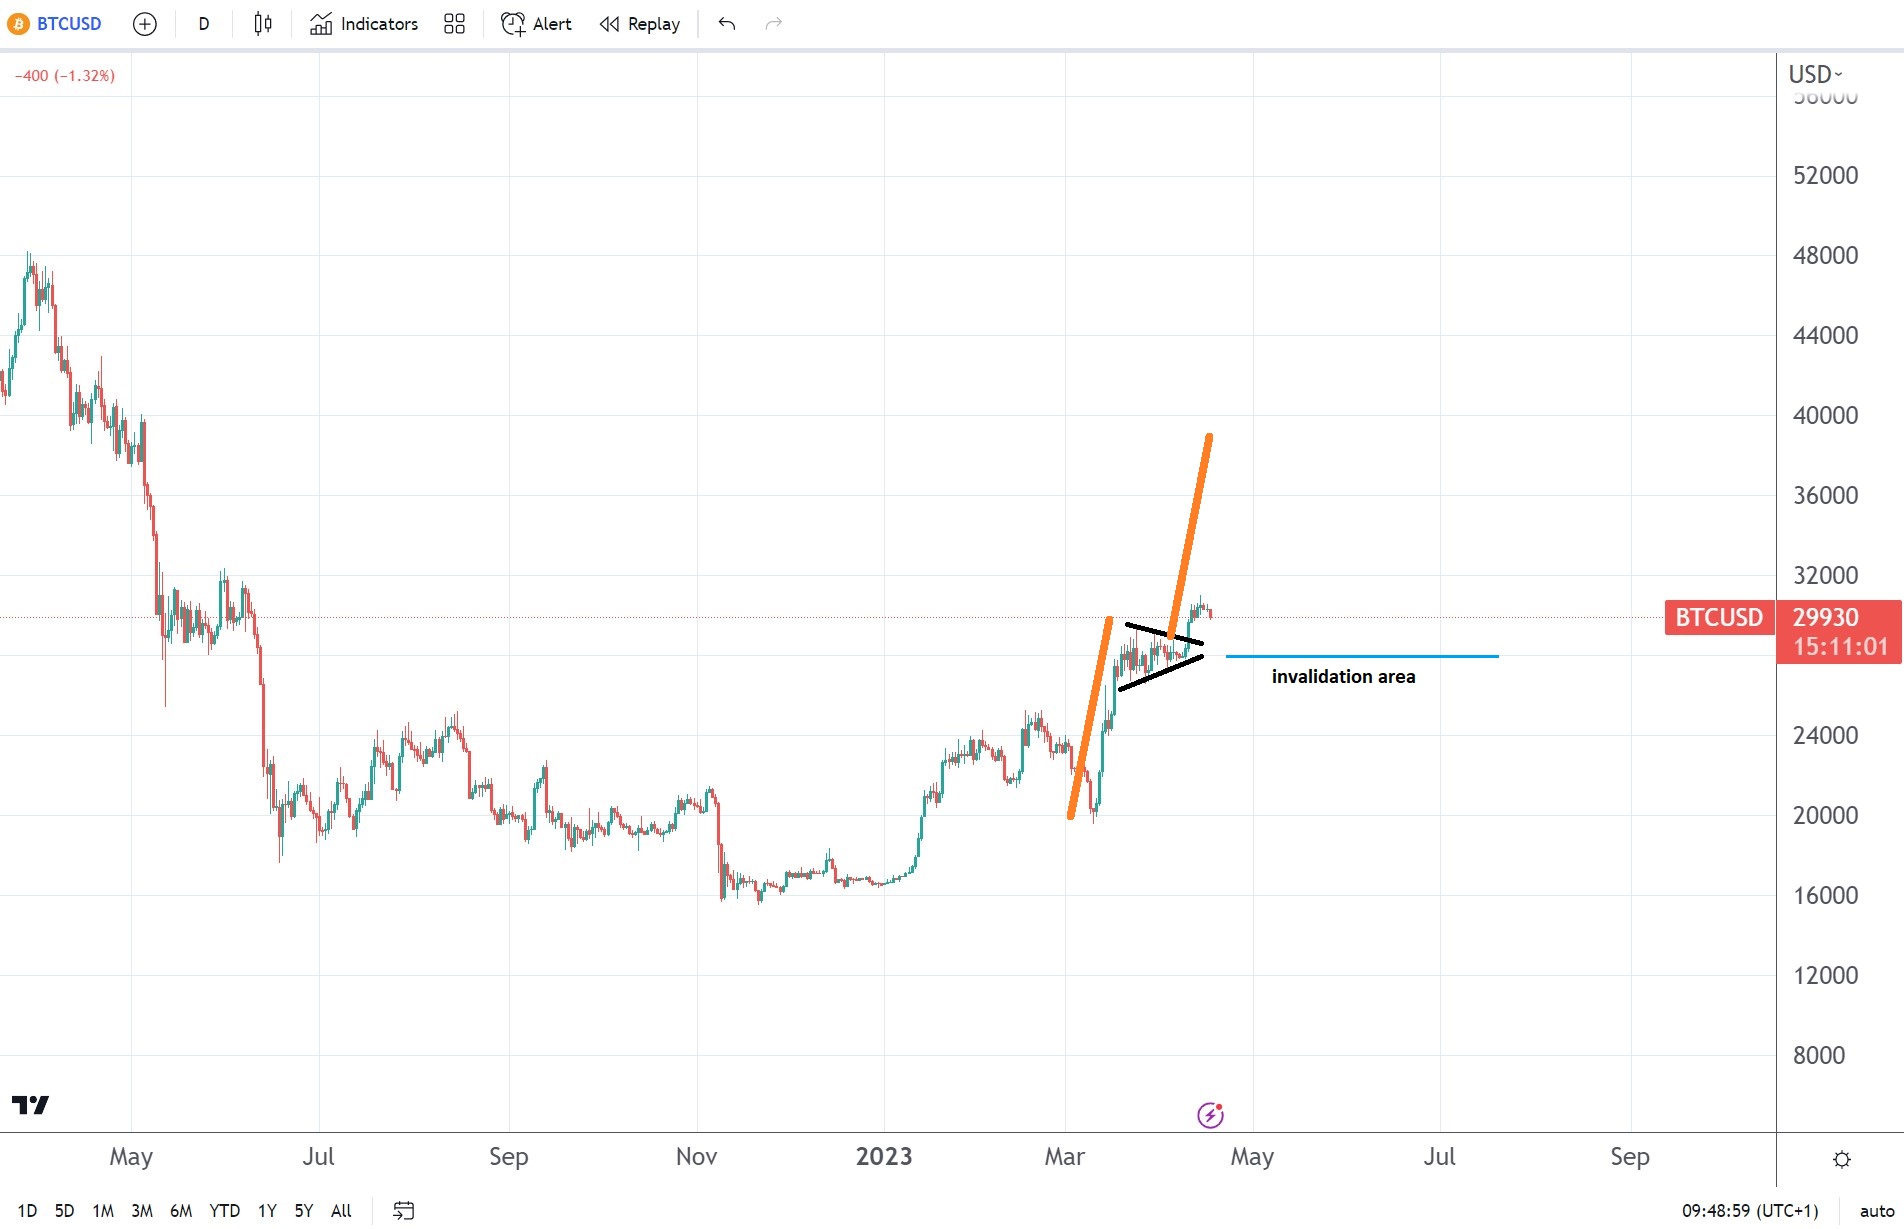
Bitcoin price bounced from the 2022 lows right from the start of 2023. It rallied more than 80% just a few months.

But Bitcoin YTD performance is in danger if the market is not strong enough to push even higher. Investors bought Bitcoin in March and in the first half of April, hoping that Bitcoin price would reach the measured move of a pennant formation.

A pennant is a bullish continuation pattern. It is made of a consolidation that takes the form of a triangle, and before the consolidation, the market must rally.

It did.

Bitcoin chart by TradingView

A similar rally should follow after the bullish breakout from the triangle. Moreover, the price should reach the measured move, seen above in orange, in about the same time it took the market to rally until the triangle’s formation.

28k is the line in the sand for the pennant

A pennant signals “more of the same.” Because it is a bullish pattern, it signals more upside.

But its “beauty” is that it allows traders to incorporate the time element into the analysis. Whenever this is possible, traders have a competitive advantage. Not only do they have an idea about where the price should go, but also when it should reach that level.

The more time passes without the market reaching the measured move, the more likely it is that the pattern will be invalidated. Such an invalidation would occur if the price drops below the 28k area.

Summing up, Bitcoin’s YTD performance is in danger as time is ticking. A failure to hold above 30k brings the 28k invalidation level into focus.

The post Bitcoin’s YTD performance in danger should this pennant fail appeared first on CoinJournal.

Similar to Notcoin - TapSwap on Solana Airdrops In 2024

origin »

Bitcoin (BTC) на Currencies.ru

$ 66872.31 (-0.08%)
Объем 24H $27.231b
Изменеия 24h: 2.04 %, 7d: 9.87 %
Cегодня L: $66739 - H: $67036.39
Капитализация $1317.397b Rank 1
Цена в час новости $ 29341.66 (127.91%)

bitcoin pennant formation performance ytd bullish invalidates

bitcoin pennant → Результатов: 47


Bitcoin Price Analysis: Pullback After Rejection at $8.3K Has a Silver Lining

Bitcoin price analysis is showing BTC/USD consolidating inside a pennant pattern, but which way will it break after being rejected at $8,300? Bitcoin price (BTC) has had a wild ride over the last 7 days, printing a new YTD-high at $8,388, experiencing a heavy flash crash the following day, only to then recover back above $8,000 again.

2019-5-20 17:00


Фото:

Bitcoin Price Analysis: Bullish Setups Could Break Current Market Structure

The cryptomarket remains coiled as we lead into the weekend with no new highs and no new lows being established for bitcoin. However, it is nicely consolidating on lower time frames and hints toward the possibility of another leg up:Figure 1: BTC-USD, Hourly Candles, Consolidating PennantThe pattern shown in Figure 1 outlines a potential continuation pattern called a “bullish pennant.

2019-2-23 02:23


Фото:

Bitcoin Price Analysis: Bear Pennant Breakout Puts $1,700 Price in Sight

Another week, another low. Bitcoin’s market has been bleeding relentlessly for weeks and now, after falling 50% in value in just one month, the market has managed to break south of a major bearish consolidation pattern called a bear pennant:Figure 1: BTC-USD, 4-Hour Candles, Bear Pennant BreakoutThis is a massive bear pennant with a staggering $2,000 measured move.

2018-12-12 01:52


Ether Price Analysis: Untested Support Leaves Shaky Foundation During Drop

Much like the rest of the crypto market, ether has found itself devalued by more than 90% since its all-time high of $1,400 back in December of 2017. And now, almost a year later, ether sits just above $100 on what appears to be shaky ground during its latest round of selling over the last few weeks:Figure 1: ETH-USD, Daily Candles, Rapid DescentSimilar to bitcoin’s movement discussed in yesterday’s article, ETH-USD experienced a parabolic growth profile during its bull run.

2018-11-28 01:55