2023-5-22 15:00 |
Data shows that Bitcoin volatility is currently at historically low levels, something that has led to violent price moves in the past.
Bitcoin 7-Day Range Has Compressed To Just 3.4% RecentlyAccording to data from the on-chain analytics firm Glassnsode, the current 7-day price range is comparable to levels seen back in January of this year. The “7-day price range” of Bitcoin here refers to the percentage difference between the highest and the lowest points that the asset’s value has observed during the last seven days.
This metric can provide hints about the recent volatility that the cryptocurrency has experienced. When the indicator has a low value, it means the price action during the last week has been quite stale. Naturally, this suggests that the volatility of the asset is low right now.
On the other hand, high values of the 7-day price range imply the coin has seen a high degree of fluctuation within the past seven days, and hence, the volatility has been high.
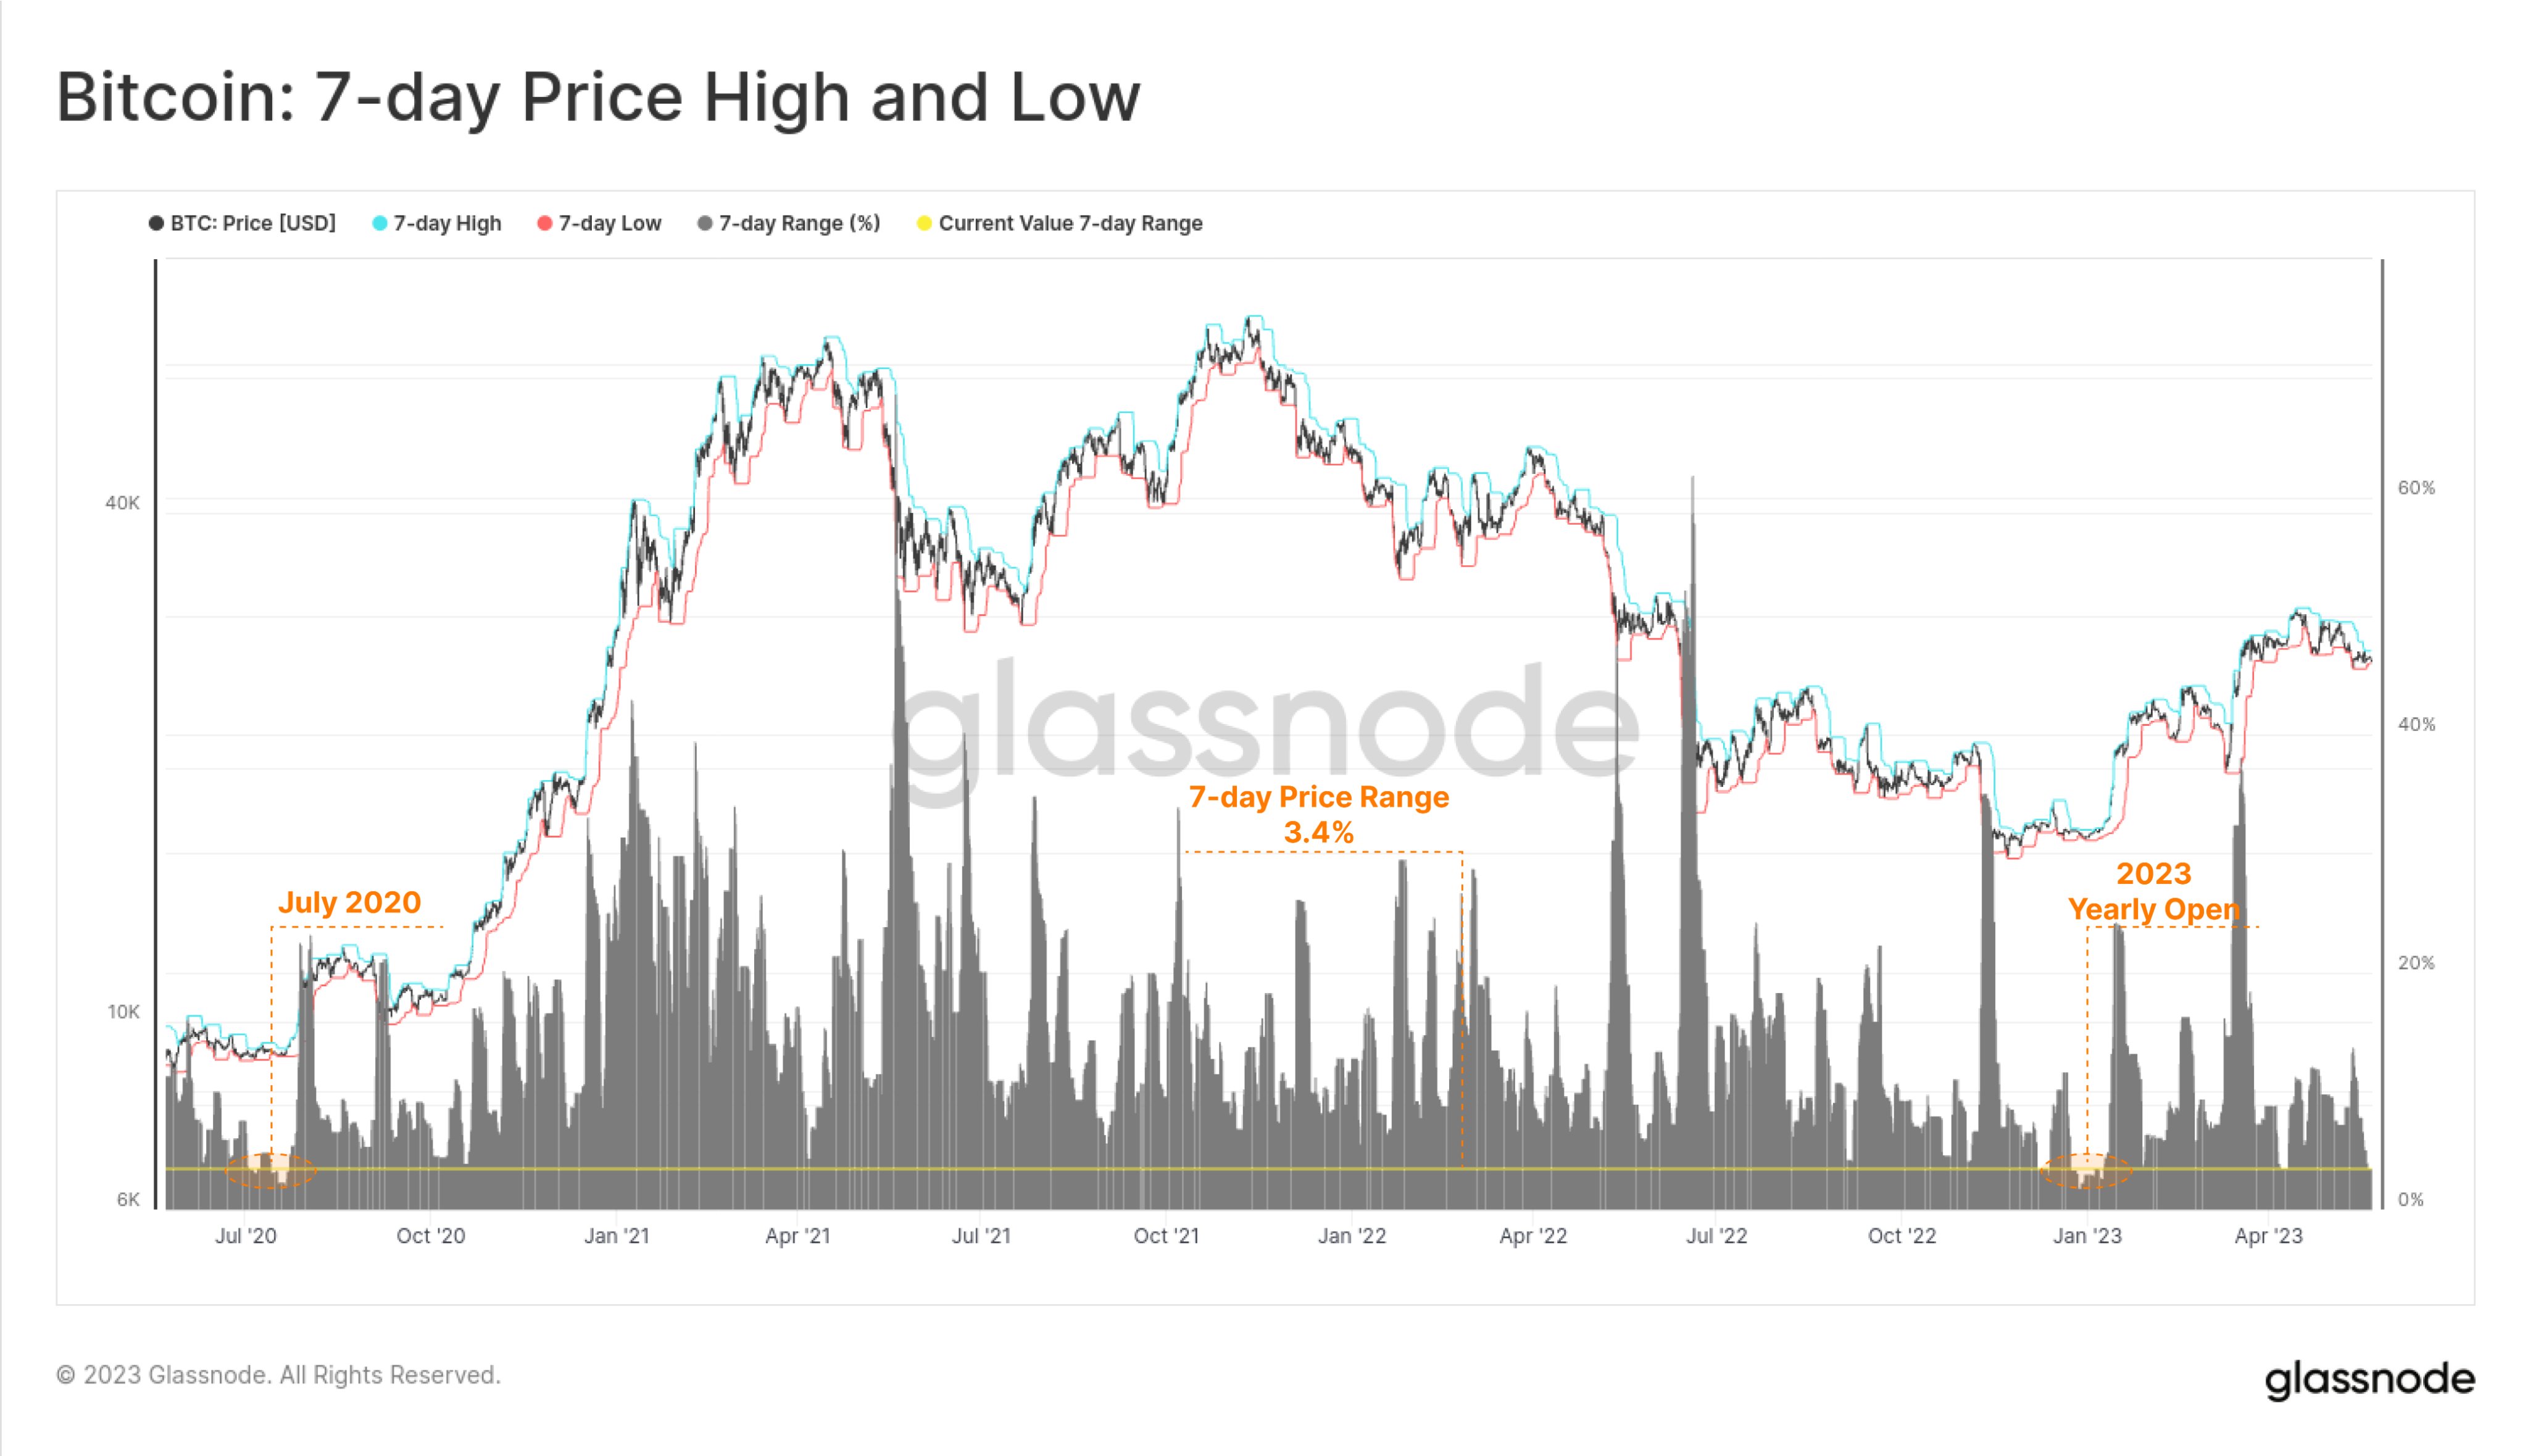
Now, here is a chart that shows the trend in the Bitcoin 7-day price range (as well as the 7-day high and low) over the last few years:
As shown in the above graph, the Bitcoin 7-day price range had naturally succumbed to quite low values during the bear market lows that had followed the FTX crash, as the BTC price had been stuck in a sideways movement.
These low values of the indicator continued into the new year as the coin refused to show any significant movement. Soon after, however, the metric’s value had seen an explosion as the rally had begun to take place.
In the next few months, the 7-day price range of the cryptocurrency had assumed relatively high values, but recently, the indicator has observed another plummet.
The reason behind this new plunge has naturally been the narrow consolidation range that the asset has followed in the past week between the $27,400 and $26,500 levels.
Because of this low volatility, the 7-day price range of Bitcoin has collapsed to only 3.4%. In the chart, Glassnode has also highlighted the previous instances where the cryptocurrency had seen this metric drop so low.
It looks like the indicator dipped to similar levels way back in July 2020, and the aforementioned lows from the start of the year had also observed the indicator attain such values.
An interesting thing to note about both these periods of low volatility is that the price had gone on to see rapid price action not too long after they occurred, and the former low was followed by the 2021 bull run, while the ongoing rally succeeded the latter one.
If the current compressed 7-day Bitcoin price range will follow a similar pattern, then some wild price action may be coming for the cryptocurrency in the near future.
BTC PriceAt the time of writing, Bitcoin is trading around $26,800, down 2% in the last week.
origin »Bitcoin price in Telegram @btc_price_every_hour
Bitcoin (BTC) на Currencies.ru
|
|