2025-1-24 13:00 |
Bitcoin is at a critical juncture after pulling back from its newly established all-time high (ATH) on Monday to test key demand levels. The cryptocurrency’s ability to hold these levels will determine whether it confirms a breakout and resumes its bullish momentum or enters a correction phase that could push it below the psychological $100,000 mark. As the market watches closely, Bitcoin faces a crucial test that could shape its trajectory in the coming weeks.
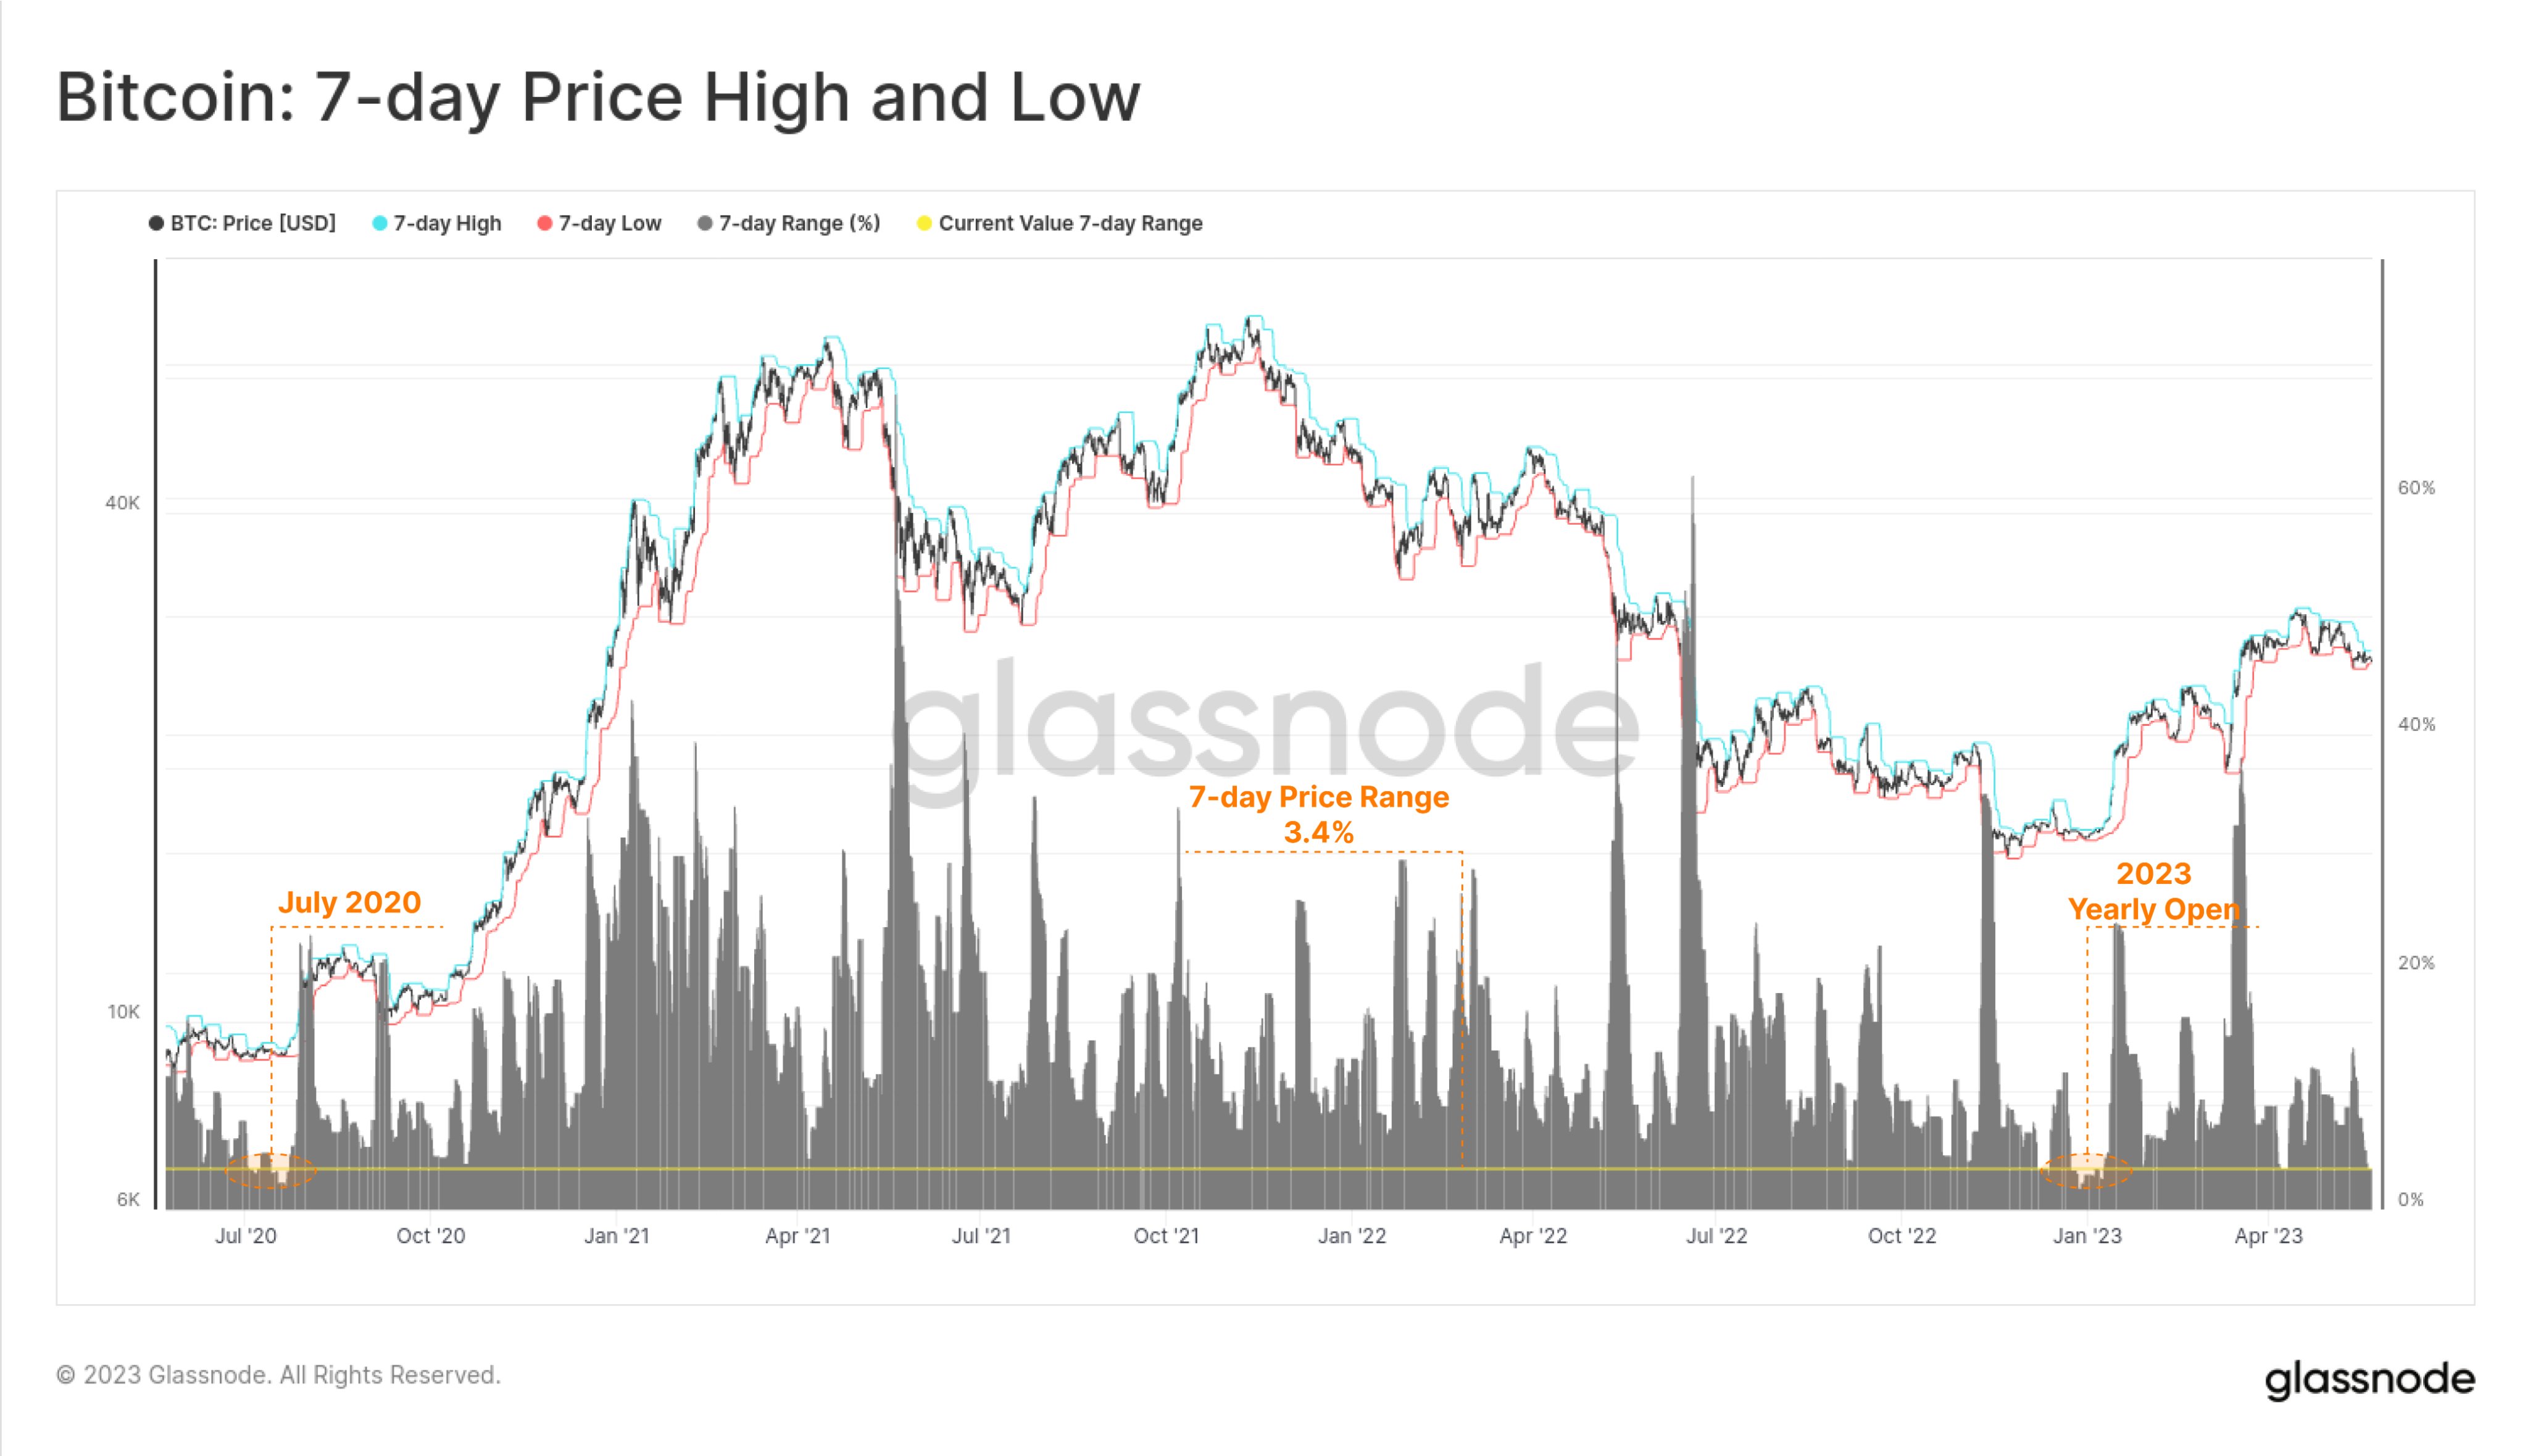
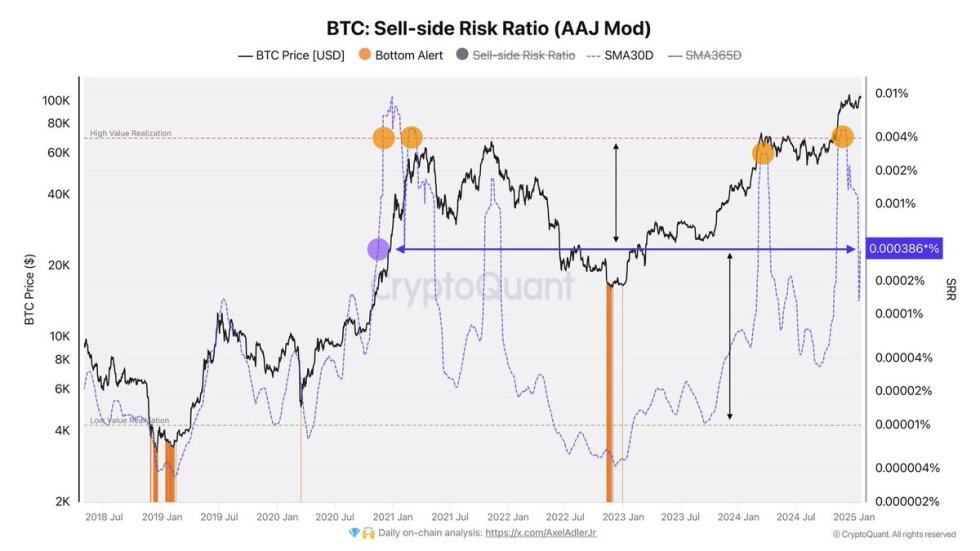
Key metrics from CryptoQuant provide insights into the current market dynamics, revealing a notable reduction in selling activity over recent weeks. This trend has led to a sharp decline in the Sell-Side Risk Ratio, a metric used to gauge the pressure from sellers relative to buyers. A lower Sell-Side Risk Ratio suggests that selling pressure has eased significantly, creating a more favorable environment for a potential bullish continuation.
While sentiment remains cautiously optimistic, Bitcoin’s ability to hold these critical demand levels will be the defining factor in the short term. A successful defense could spark renewed buying interest and set the stage for another push toward uncharted territory. Conversely, losing these levels may lead to a prolonged consolidation or correction phase, testing investor confidence.
Bitcoin Activity Suggests A Strong Move AheadBitcoin is currently navigating a phase of heightened volatility, with market sentiment fluctuating amid widespread uncertainty. While the price remains above critical levels, analysts are anticipating a consolidation phase—a common precursor to significant market moves. This period of stabilization could help Bitcoin build a stronger foundation for its next potential rally or, conversely, signal a deeper correction.
Top analyst Axel Adler has provided valuable insights into the current market dynamics, sharing data from CryptoQuant on X. According to Adler, there has been a notable reduction in selling activity over recent weeks, resulting in a sharp decline in the Sell-Side Risk Ratio. This metric measures the pressure from investors selling their holdings relative to those buying, and its decline indicates that much of the planned profit and loss realization by market participants has already occurred.
Although the current Sell-Side Risk Ratio remains slightly above its long-term averages, its downward trend suggests reduced market activity and a potential buildup for the next phase of volatility. In essence, the market appears to be in a transitional state, waiting for new catalysts to drive a decisive move.
As Bitcoin holds above key support levels, its ability to consolidate and stabilize will be crucial in setting the tone for the coming weeks. Whether the next move is upward or downward, the reduced selling pressure and overall market dynamics hint at a significant shift ahead. Investors are closely watching for signs of renewed momentum as Bitcoin prepares for what could be another defining phase in its cycle.
BTC Testing Liquidity Below ATHBitcoin (BTC) is trading at $101,800 following a weekend and start to the week marked by intense volatility. While BTC has managed to stay above the critical $100,000 mark, this level remains a key line of defense for bulls aiming to maintain upward momentum. To solidify a bullish structure, BTC must hold above $100K and push through key resistance levels that are currently capping its price.
The first target for a bullish breakout is $103,600, a level that has acted as a significant barrier in recent trading sessions. Clearing this resistance could pave the way for BTC to challenge its all-time high (ATH) of $109,900. Achieving this would likely attract fresh buying interest, fueling further upward momentum and potentially pushing BTC into a new phase of price discovery.
However, the risk of a deeper correction looms if BTC fails to reclaim these levels in the coming days. Losing the $100K mark could trigger increased selling pressure, leading to a drop into lower support zones and prolonging the consolidation phase.
The next few days will be critical for Bitcoin as it attempts to regain strength and sustain its position above $100K. Investors are closely monitoring these levels, awaiting BTC’s next major move.
Featured image from Dall-E, chart from TradingView
origin »Bitcoin price in Telegram @btc_price_every_hour
Bitcoin (BTC) на Currencies.ru
|
|