2023-6-24 04:00 |
Data shows the Bitcoin monthly average trading volume has now surpassed the yearly average one. Here’s why this may be bullish for the asset.
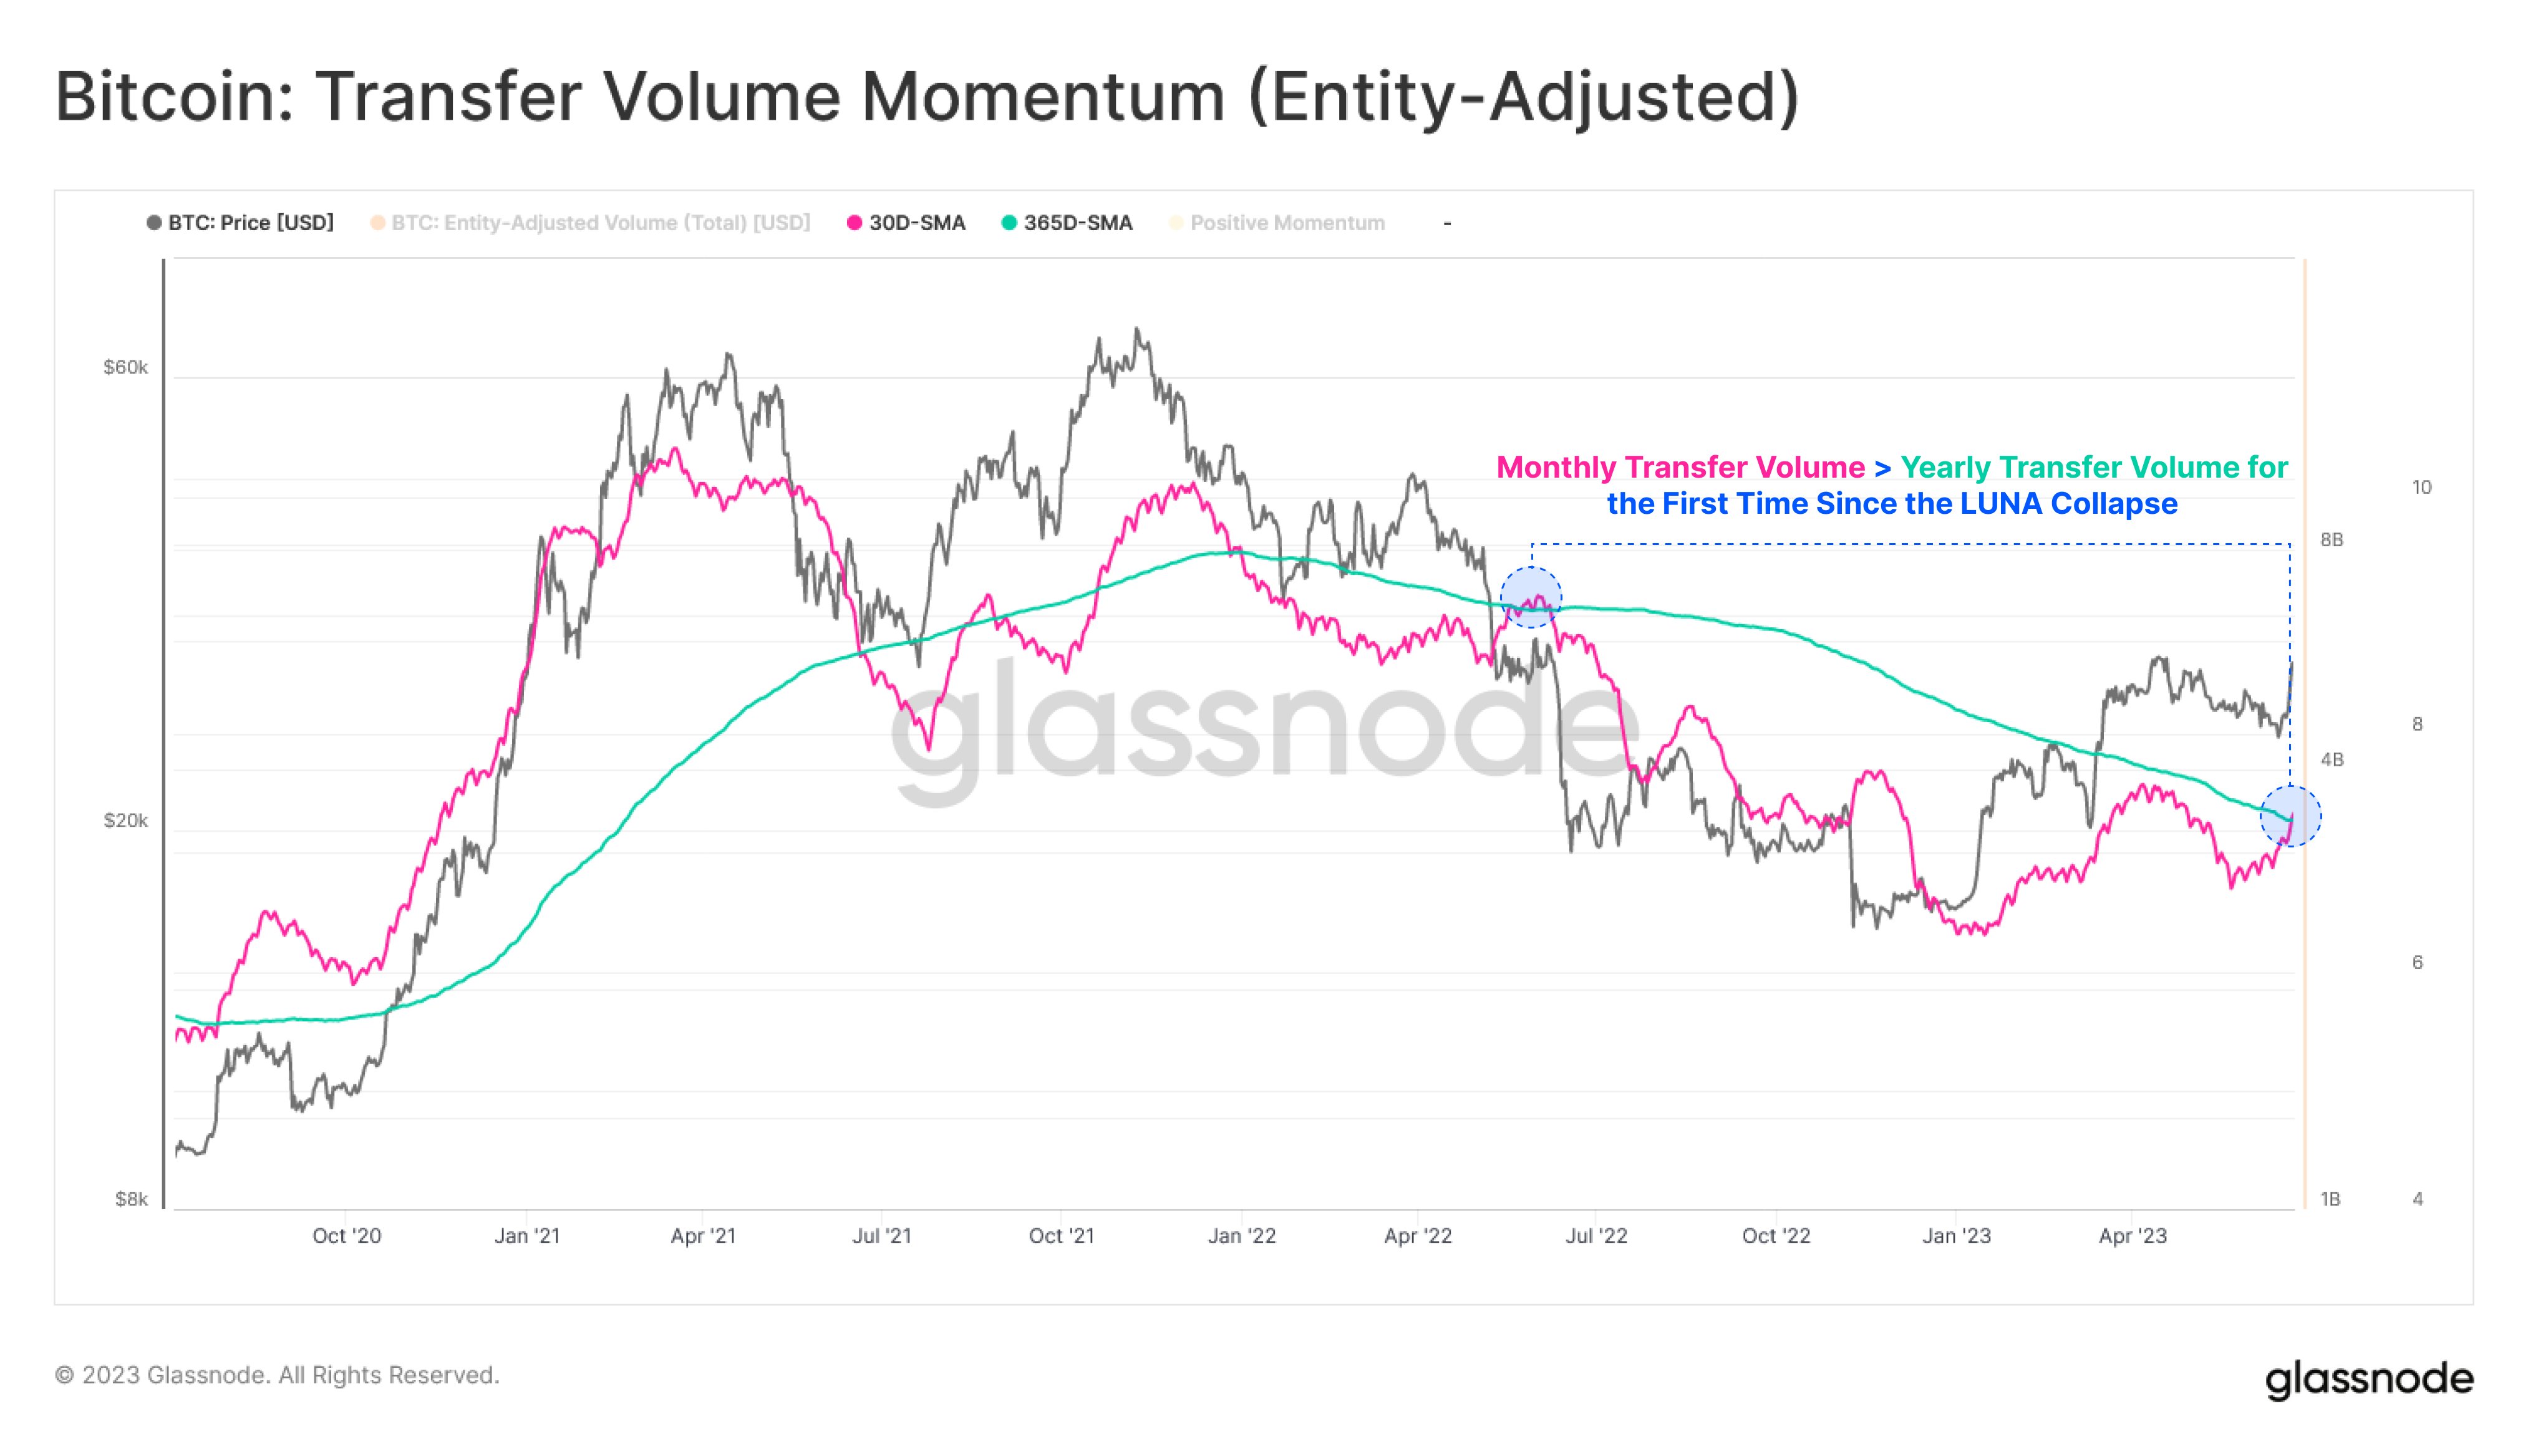
Bitcoin 30-Day SMA Volume Has Crossed Above The 365-Day SMAAccording to data from the on-chain analytics firm Glassnode, this is the first time since the LUNA collapse that this pattern has formed for the cryptocurrency. The “trading volume” here refers to the total amount of Bitcoin the investors are moving around on the blockchain.
When the value of this metric is high, it means that many coins are getting involved in transactions on the network. Such a trend is usually a sign that the traders are currently active in the market.
On the other hand, low indicator values imply that the chain is observing little activity currently. This trend can hint that the general interest in the asset is low among investors.
Now, here is a chart that shows the trend in the 30-day simple moving average (SMA) Bitcoin trading volume, as well as the 365-day SMA of the same, over the past few years:
The above graph shows that the 30-day SMA Bitcoin trading volume has risen recently. This would suggest that the activity on the network has been seeing an uplift.
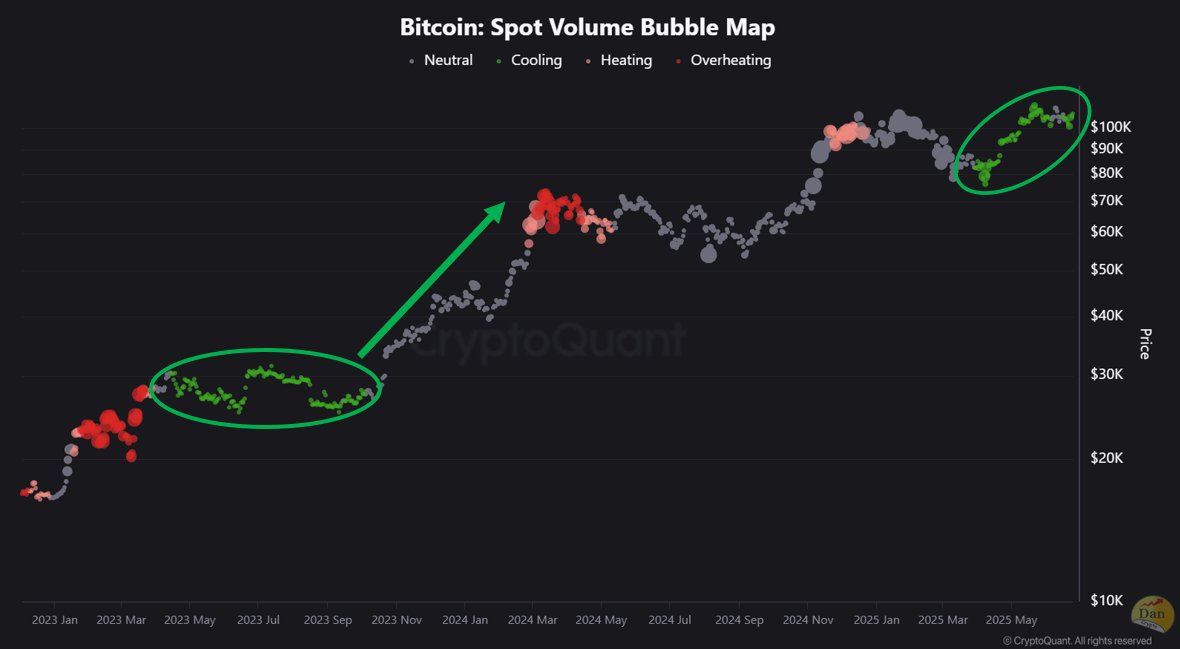
The ramp-up in the number of coins being shifted around the network has come as the cryptocurrency has observed a sharp rally, which has now taken the price above the $31,000 level.
Generally, rallies attract attention to the asset, as investors usually find such price action exciting. Thus, it’s not unexpected that the volume has gone up with this price surge.
With this latest rise, the metric has caught up with the 365-day SMA and has just slightly crossed above it. The formation of this pattern implies that the monthly average trading volume of the asset has finally surpassed the average for the past year.
The chart shows that the last time the two lines showed this behavior was around the time of the LUNA collapse. Other than this brief period, the 30-day SMA of the indicator has been under the 365-day SMA for the entirety of the bear market and the rally so far, showing how low the asset’s activity has been in this period.
However, this trend might finally be changing if the latest crossover between these two lines sticks this time, unlike the one seen around the time of the LUNA crash.
Increasing network activity is usually a constructive sign for Bitcoin, as it suggests growth in utilization. Notable rallies in the asset have historically accompanied growing volumes, as such price moves require many active traders to be sustainable.
As the chart shows, the monthly and yearly SMAs of the BTC trading volume also showed a similar crossover during the buildup towards the 2021 bull run.
BTC PriceAt the time of writing, Bitcoin is trading around $31,200, down 18% in the last week.
origin »Bitcoin price in Telegram @btc_price_every_hour
Volume Network (VOL) на Currencies.ru
|
|