Bitcoin Futures Fakeout: The Price Divergence That Predicts A Phony

Bitcoin Futures Fakeout: The Price Divergence That Predicts A Phony
фото показано с : newsbtc.com

2023-8-11 01:16

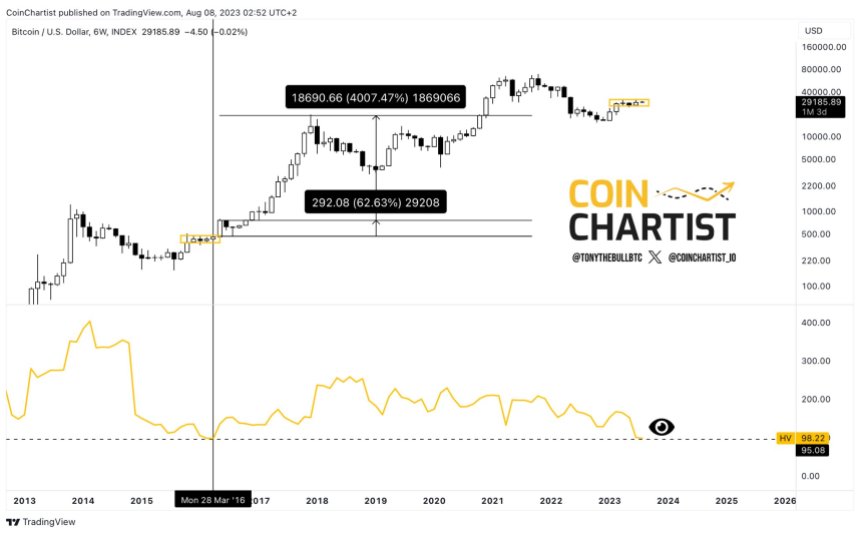
This week, Bitcoin traders braced for a breakout as an important technical buy signal triggered and BTCUSD shot up over $30,000 temporarily.

They came up short-handed, however, as the market took an immediate turn back down. Interestingly, the fakeout could have possibly been predicted by a divergence between two BTCUSD price charts.

Why Price Patterns And Technical Signals Can Fail

Price patterns are tough to trade in cryptocurrencies. Because so many eyes are on the same pattern meeting precise parameters, the market has a way of making people pay for acting on the obvious. For example, a rising wedge pattern is typically bearish, but could breakout to the upside.

The same is true for technical signals that a large portion of traders are paying attention to, such as notable crossovers and changes in momentum. This is exactly the case recently with a bullish crossover of the daily BTCUSD Moving Average Convergence Divergence (MACD).

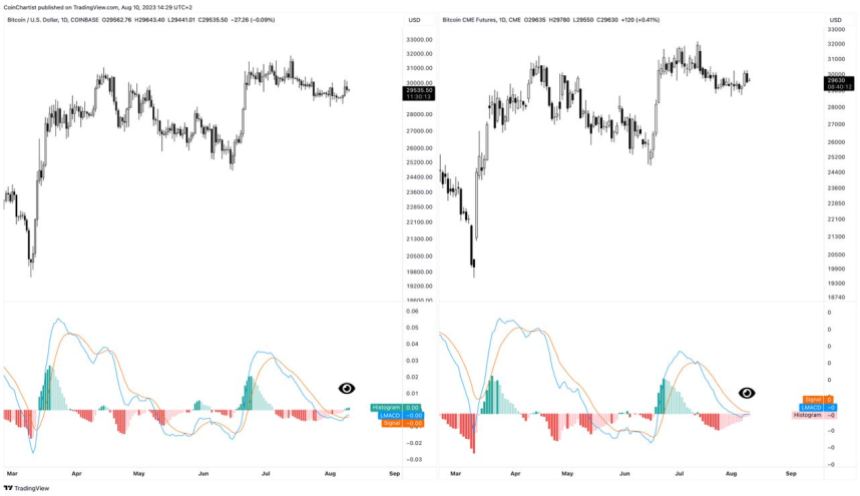
The MACD is a momentum indicator that gives a buy signal when the MACD line crosses the signal line from below. This signal not only has appeared in Bitcoin, but it confirmed on BTCUSD spot exchanges, so what gives? It was a phony signal from the “future.”

Spot Possible Divergences With Bitcoin Futures

By “future” we mean BTC CME Futures, also known as Chicago Mercantile Exchange’s Bitcoin derivatives product, which institutions use to speculate on the underlying price of BTCUSD. The BTC CME Futures chart doesn’t always reflect spot BTCUSD charts 1:1. Any divergences between the two platforms, has historically led to fakeouts and phony breakouts.

Part of the reason for this is due to the platform shutting down for a short period each day, and for the entire weekend starting at Friday afternoon. The result is a Bitcoin chart with more traditional market traits, such as gaps. The missing price data also changes the calculation of many technical indicators. For example, moving averages are in slightly different locations from chart to chart.

This is precisely how the recent “fakeout” higher was able to be predicted with a degree of accuracy. This discrepancy and divergence leading to false signals is nothing new and has been happening for years. When BTC CME finally participates in the same signal, the expected results often then arrive.

Is this a situation similar to Dow Theory, where the DJIA and DJTA must confirm one another for a trend to be valid? Or is there some more at play? Whatever the case may be, there’s enough historical evidence at this point to pay attention to any divergences between spot and CME Futures.

Similar to Notcoin - TapSwap on Solana Airdrops In 2024

origin »

Bitcoin (BTC) на Currencies.ru

$ 66949.02 (+0.04%)
Объем 24H $27.448b
Изменеия 24h: 2.14 %, 7d: 10.27 %
Cегодня L: $66739 - H: $67036.39
Капитализация $1318.886b Rank 1
Цена в час новости $ 29383.37 (127.85%)

bitcoin btcusd shot temporarily came immediate turn

bitcoin btcusd → Результатов: 125


Bitcoin Breaks Out Of Ichimoku Cloud, Storms Toward $28,000

Bitcoin price has made an intraday move higher, pushing above the Ichimoku cloud on BTC CME Futures daily charts. This signal in the past sent the entire cryptocurrency market soaring higher. Will crypto once again continue to storm ahead, or is it about to rain more pain on investors? Bitcoin Storms Above $28,000 After Technical Breakout BTCUSD made a 4% move higher today.

2023-6-21 23:56


Bitcoin Weekly Momentum Crosses Bearish For First Time In 2023

In a significant development this week, Bitcoin price has crossed bearish on the weekly LMACD (Logarithmic Moving Average Convergence Divergence), marking the first time this has occurred in 2023. Does this mean further decline for BTCUSD, or do bulls still have a chance to save the recent uptrend? Bitcoin Momentum Takes A Turn For The Bears Last night, the weekly candle in BTCUSD opened with a bearish crossover of the LMACD.

2023-6-6 02:41


Фото:

Bitcoin Price Double Fractal Points To “Extended” Parabolic Rally

Bitcoin price seems to merely be grinding upwards, with a dusting of chop in between. What corrections have arrived have been minimal, and are shockingly similar in both time and price. This fractal behavior could be a sign of an important Elliott Wave signal, that not only says that BTCUSD is about to go parabolic, but that the rally should be “extended” in its price movement.

2023-5-16 02:01


Bitcoin Bounces On Lower Than Expected CPI Data | BTCUSD November 10, 2022

Bitcoin has taken 10% back in a dramatic move following the announcement of October CPI data. CPI came in below expectations, causing a melt up in risk assets including cryptocurrencies. Take a look at the video below: VIDEO: Bitcoin Price Analysis (BTCUSD): November 10, 2022 Before suggesting any type of bottom is in, more downside could still be ahead, with this recent movement being nothing more than a bearish retest.

2022-11-11 21:42


The Inverted Bitcoin Chart Bears Don’t Wanna See | BTCUSD Analysis October 27, 2022

In this episode of NewsBTC’s daily technical analysis videos, we flip the Bitcoin price chart upside down to get a unique perspective on the market. Take a look at the video below: VIDEO: Bitcoin Price Analysis (BTCUSD): October 27, 2022 We also examine a weekly buy signal on BTCUSD using the Relative Strength Index, and show several examples of the signal’s effectiveness using Bitcoin and other assets.

2022-10-28 23:13


The End of Bitcoin Woes? BTCUSD Analysis October 11, 2022

In this episode of NewsBTC’s daily technical analysis videos, we examine a possible bottoming scenario in Bitcoin price based on a potential expanded flat correction and an ending diagonal. Take a look at the video below: VIDEO: Bitcoin Price Analysis (BTCUSD): October 11, 2022 Bears and bulls are battling it out once again, each side trying to take control over daily momentum.

2022-10-12 22:51


WATCH: Bitcoin Bloody Monday Leads To Reversal Hammer | BTCUSD September 19, 2022

In this episode of NewsBTC’s daily technical analysis videos, we examine a recent showing from bulls after a bloody Monday morning open in Bitcoin price action. Take a look at the video below: VIDEO: Bitcoin Price Analysis (BTCUSD): September 19, 2022 Last night, we had the weekly close in Bitcoin price, and overnight, there was a deep plunge to the low $18K region.

2022-9-20 18:55


WATCH: Bitcoin Brutalized After August CPI Data Release | BTCUSD September 13, 2022

In this episode of NewsBTC’s daily technical analysis videos, we take a look at Bitcoin price action following today’s selloff in reaction to August CPI numbers. Take a look at the video below: VIDEO: Bitcoin Price Analysis (BTCUSD): September 13, 2022 Today just so happened to be August CPI numbers release day, so volatility was expected all around.

2022-9-14 20:05


WATCH: Bitcoin, Wyckoff Theory, And The Composite Man | BTCUSD September 8, 2022

In this episode of NewsBTC’s daily technical analysis videos, we compare Bitcoin price action with Wyckoff accumulation schematics, price cycles and more. Take a look at the video below: VIDEO: Bitcoin Price Analysis (BTCUSD): September 8, 2022 This video provides a detailed look at Bitcoin market cycles using Wyckoff theory and other cyclical tools.

2022-9-9 21:50


WATCH: Weekend At Bitcoin’s: Will The Dead Crypto Make A Comeback? BTCUSD September 2, 2022

In this episode of NewsBTC’s daily technical analysis videos, we are going to look at the weekly timeframe on Bitcoin BTCUSD in anticipation of the weekend and weekly close. Take a look at the video below: VIDEO: Bitcoin Price Analysis (BTCUSD): September 2, 2022 With the monthly open now out of the way and Friday here, we are looking ahead at the weekend close ahead of what could be an interesting weekend in the crypto market.

2022-9-3 22:35


Inverse Signals: Why Bitcoin Weakness Is Attributed To Dollar Strength

Bitcoin price is currently on the ropes, potentially about to lose support at around $56,000. But could the recent weakness in the cryptocurrency market be more a factor of a strong dollar? TD Sequential Triggers Anti-Correlated Signals On BTCUSD, DXY Weeks ago, we posed the question if or not the Dollar Currency Index making new highs in 2021 was a dangerous situation for Bitcoin.

2021-11-23 00:39