Bitcoin Breaks $21k As Market Shows Signs Of Accumulation

2022-11-5 22:00

Bitcoin has today broken past $21k in a sharp surge as on-chain data suggests signs of accumulation from the investors.

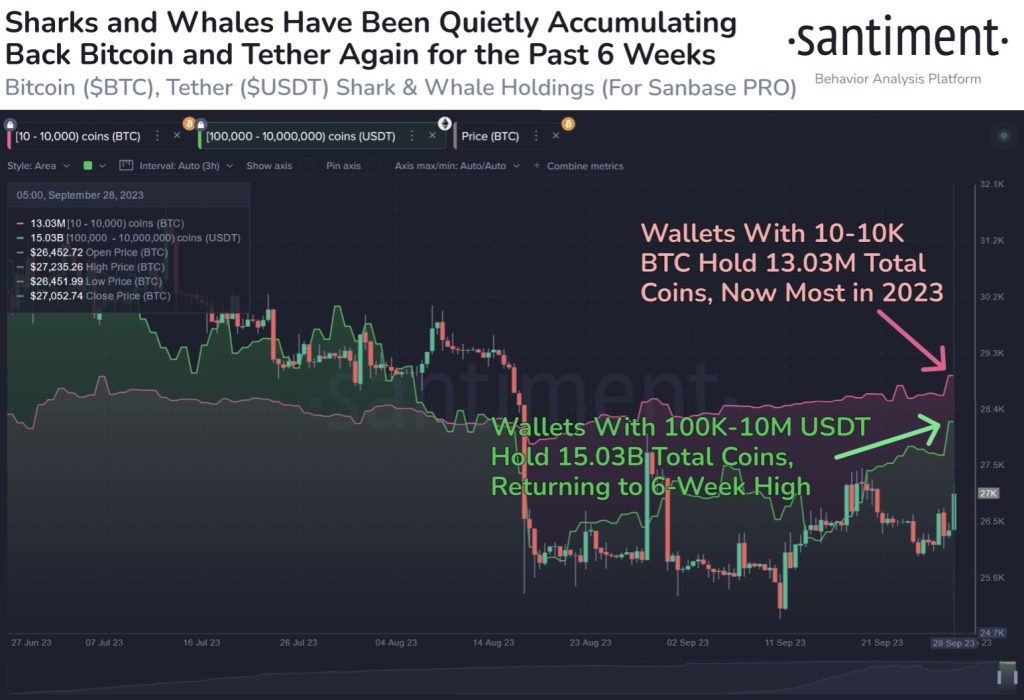
Bitcoin UTXO Value Bands Show Multiple Groups Have Been Buying Recently

As pointed out by an analyst in a CryptoQuant post, the value bands who took profit around ten days ago are now accumulating again.

The relevant indicator here is the “UTXO value bands,” which tells us what percentage of the total Bitcoin supply is held by which groups.

The value bands or groups here are divided based on the number of coins in each Unspent Transaction Output (UTXO), or simply, the amount currently held in each wallet.

For example, the 1k-10k BTC value band includes all wallets that are currently holding between 1k and 10k BTC.

When any value band shows an uptrend, it means the number of wallets in that specific range are going up.

In context of the current discussion, the relevant value bands are the 0.1-1 BTC, 1-10 BTC, and 10-100 BTC cohorts.

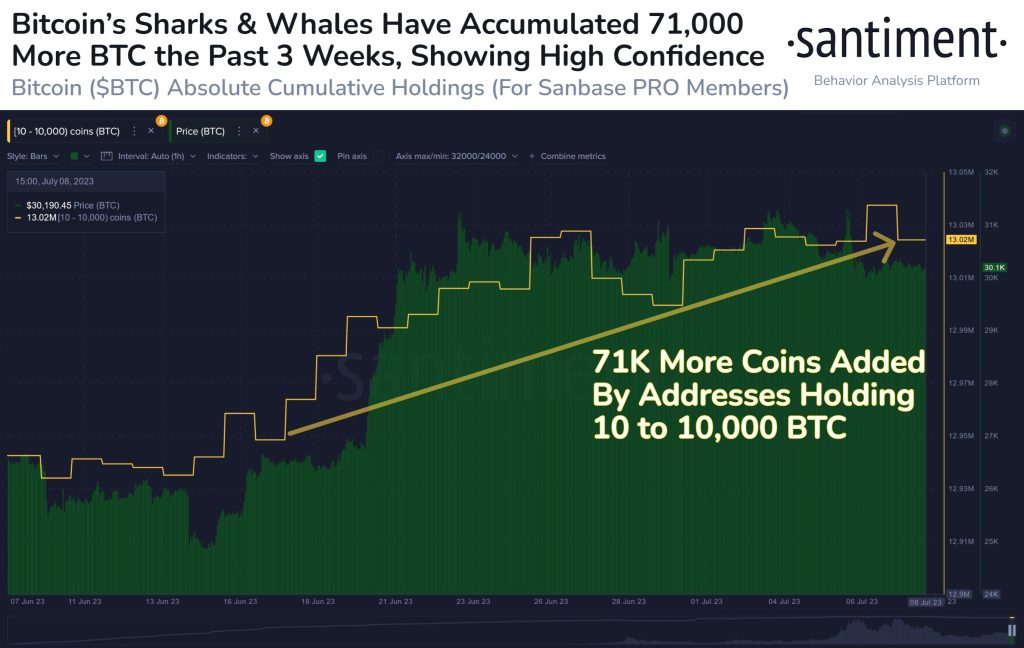
Here is a chart that shows the trend in the UTXO value band percentages for each of these groups:

Looks like all these metrics have been going up in the last couple of days | Source: CryptoQuant

As you can see in the above graph, when the price of Bitcoin first started to rally up, all three of these value bands started dropping down.

This means that investors with wallet amounts in these ranges started to dump as a profit-taking opportunity arose.

By the time the price peaked, these metrics hit a low, and then followed up with trending sideways (along with the price).

In the last couple of days, however, the percentage of the Bitcoin supply in these UTXO value bands has once again started to move up.

This means that there has been some market-wide accumulation going on above the $20k level, showing that investors have conviction the price will increase further.

And indeed, following this buying spree, the crypto has sharply shot up in the past day, breaking above the $21k level again.

BTC Price

At the time of writing, Bitcoin’s price floats around $21.1k, up 3% in the last week. Over the past month, the crypto has gained 8% in value.

Below is a chart that shows the trend in the price of the coin over the last five days.

The value of the crypto seems to have seen some very sharp uptrend in the last twenty-four hours | Source: BTCUSD on TradingView Featured image from Sandra Seitamaa on Unsplash.com, charts from TradingView.com, CryptoQuant.com

Similar to Notcoin - TapSwap on Solana Airdrops In 2024

origin »

Bitcoin (BTC) на Currencies.ru

$ 66732.73 (+0.10%)
Объем 24H $16.97b
Изменеия 24h: -0.19 %, 7d: 8.29 %
Cегодня L: $66619.5 - H: $67668.16
Капитализация $1314.665b Rank 1
Цена в час новости $ 21364.69 (212.35%)

bitcoin accumulation value bands 21k signs analyst

bitcoin accumulation → Результатов: 126


Фото:

Bitcoin Price Analysis: Slow Upward Drift Tests Market Supply

A slow, grinding upward drift has been the name of the game for bitcoin’s market over the last few weeks. The upward drift is bringing us slowly to a level that was previously rejected violently:Figure 1: BTC-USD, Daily Candles, Upward DriftOur third rejection of the red resistance level shown above brought the market into a test of macro support in the mid-$3,000s.

2019-3-23 01:23


Bitcoin SV (BSV) Long-term Price Analysis – March 2

BSV/USD market slight downward movement appears to be imminent. A decent long entry may be found under the two SMAs while traders need to exercise patience. BSV/USD Long-term Trend – Ranging Distribution territories: $90, $100, $110 Accumulation territories: $40, $30, $20 Between February 24 and 27, BSV/USD trade witnessed notable both decline and uprise during […]

2019-3-2 12:03


Фото:

New Data Shows Bitcoin Accumulation is in Full Swing

Bullish signs are everywhere for Bitcoin (BTC) March 1st as the largest cryptocurrency continues its record-breaking bear market cycle in 2019. Addresses Amassing Coins At 4K Capping a fifth day of broad stability, the bitcoin price was holding steady at around $3850 Friday, while data from traders suggested February ended the worst six-month performance for bitcoin ever recorded.

2019-3-1 18:00


Bitcoin SV (BSV) Long-term Price Analysis – February 23

BSV/USD market still sees its major range movements under downward pressure mode. A strong price action needs to be awaited to effect a change in the current market trend. BSV/USD Long-term Trend – Ranging Distribution territories: $90, $100, $110 Accumulation territories: $40, $30, $20 Trade between the USD and BSV still features within the range […]

2019-2-23 12:04


Фото:

Bitcoin Price Analysis: Strong Move Likely Following Tightly Coiled Market

Days and days of sideways consolidation and tightening volume has been the name of the game for the bitcoin market. A narrow range of $200 has caused a weeks worth of activity to coil and consolidate in preparation for bitcoin’s next move:Figure 1: BTC-USD, Daily Candles, Narrow RangeThe figure above shows just how narrow the range has been over the last week as the market has continued to grind out support and fail to break above overhanging resistance.

2019-1-26 03:13


Cryptocurrency analysts predict the end of the Bitcoin bear market

Blockchain investigators have employed a neat method for analyzing Bitcoin activity to determine at what point long-term holders typically yield and sell their Bitcoin. Delphi Digital, an independent research boutique specializing in the digital asset market, has studied Bitcoin transaction data and market prices, calculating that Bitcoin investors are (for the most part) done with their selling.

2019-1-10 19:02