Bitcoin accumulation fails to keep pace with issuance

Bitcoin accumulation fails to keep pace with issuance
фото показано с : cryptoslate.com

2024-5-9 17:24

Quick Take

Over the past 30 days, entities across all cohorts have accumulated just over 10,000 BTC. This rate of accumulation has not kept up with the approximately 19,000 BTC issued during that same timeframe.

Before the halving, Bitcoin’s monthly issuance stood at 27,000 BTC but reduced to 13,500 BTC after the halving. However, looking at the data for the last 30 days, we can see that the monthly issuance has averaged roughly 19,000 BTC.

Graph comparing Bitcoin accumulation from all cohorts and monthly issuance from Jan. 1 to May 7, 2024 (Source: Glassnode)

The monthly accumulation has been below the monthly issuance rate since May 1, when Bitcoin hit a local low of under $57,000. This lack of strong demand shows that we could see the upward price pressure wane in the coming days and weeks.

A similar scenario took place when Bitcoin reached its all-time high (ATH) in March. Between March 3 and March 22, accumulation did not keep up with issuance, and prices retreated shortly after.

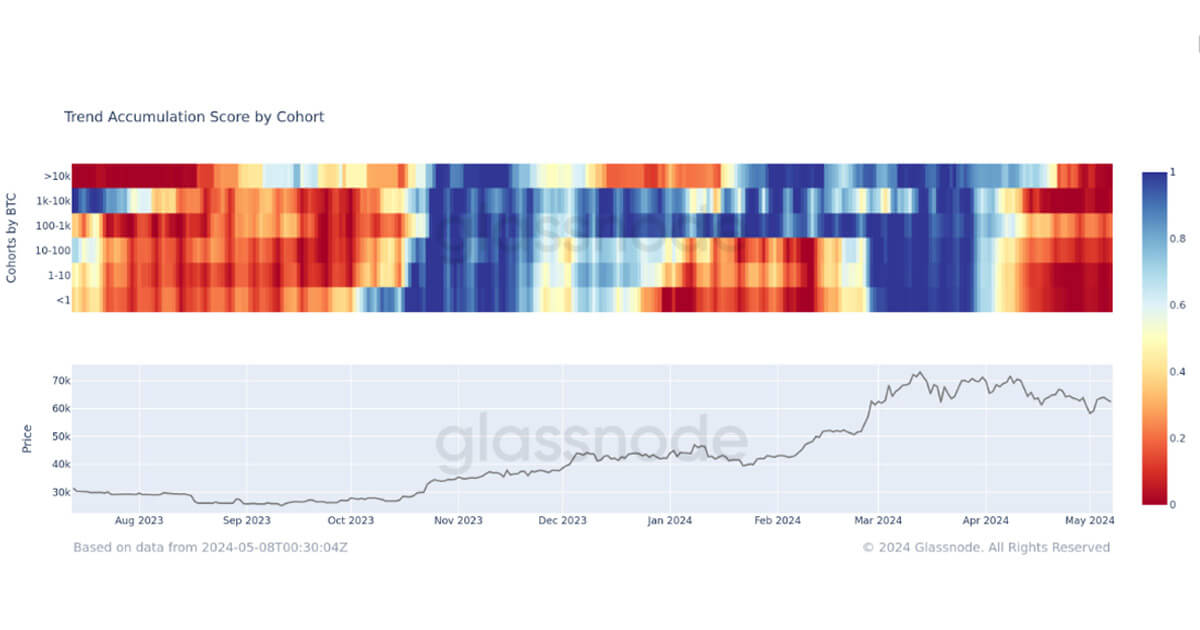
The accumulation trend score by cohort assesses the quantity of coins cohorts have accumulated over the past 15 days, employing a slightly different moving average that bolsters a similar narrative. Following the intense accumulation until March, which propelled BTC to its ATH, all cohorts began selling off their assets shortly after. The severe distribution has persisted since, with the latest data from March showing no signs of change.

The convergence of these on-chain indicators—tepid accumulation compared to issuance and distribution across cohorts—suggests further short-term headwinds for Bitcoin.

Graph showing the accumulation trend score by cohort from June 2023 to May 2024 (Source: Glassnode)

The post Bitcoin accumulation fails to keep pace with issuance appeared first on CryptoSlate.

Similar to Notcoin - TapSwap on Solana Airdrops In 2024

origin »

Bitcoin (BTC) на Currencies.ru

$ 66760.03 (-0.19%)
Объем 24H $23.035b
Изменеия 24h: -0.61 %, 7d: 6.33 %
Cегодня L: $66031.14 - H: $67143.86
Капитализация $1315.227b Rank 1
Цена в час новости $ 60972.55 (9.49%)

btc accumulation timeframe kept rate issued approximately

btc accumulation → Результатов: 126


Фото:

Bitcoin Price Analysis: Slow Upward Drift Tests Market Supply

A slow, grinding upward drift has been the name of the game for bitcoin’s market over the last few weeks. The upward drift is bringing us slowly to a level that was previously rejected violently:Figure 1: BTC-USD, Daily Candles, Upward DriftOur third rejection of the red resistance level shown above brought the market into a test of macro support in the mid-$3,000s.

2019-3-23 01:23


Фото:

New Data Shows Bitcoin Accumulation is in Full Swing

Bullish signs are everywhere for Bitcoin (BTC) March 1st as the largest cryptocurrency continues its record-breaking bear market cycle in 2019. Addresses Amassing Coins At 4K Capping a fifth day of broad stability, the bitcoin price was holding steady at around $3850 Friday, while data from traders suggested February ended the worst six-month performance for bitcoin ever recorded.

2019-3-1 18:00


Фото:

Bitcoin Price Analysis: Strong Move Likely Following Tightly Coiled Market

Days and days of sideways consolidation and tightening volume has been the name of the game for the bitcoin market. A narrow range of $200 has caused a weeks worth of activity to coil and consolidate in preparation for bitcoin’s next move:Figure 1: BTC-USD, Daily Candles, Narrow RangeThe figure above shows just how narrow the range has been over the last week as the market has continued to grind out support and fail to break above overhanging resistance.

2019-1-26 03:13


Ether Price Analysis: Historic Support Tested Amid Signs of Distribution

It’s been weeks since ether has seen a new high or a new low and the market has found itself range-bound. At the moment, we are seeing signs of distribution as large rounds of selling have remained present during key support tests:Figure 1: ETHUSD, 4 Hour Candles, Trading RangeSo far, for the last few weeks, ether has seen a trend of higher lows and low highs (the converging red trendlines).

2018-10-20 01:31