2022-6-15 13:18 |
Ether is showing first signs of reversal as divergence appears on intraday chart origin »
Bitcoin price in Telegram @btc_price_every_hour
ChartEx (CHART) на Currencies.ru
|
|
2022-6-15 13:18 |
Ether is showing first signs of reversal as divergence appears on intraday chart origin »
Bitcoin price in Telegram @btc_price_every_hour
|
|
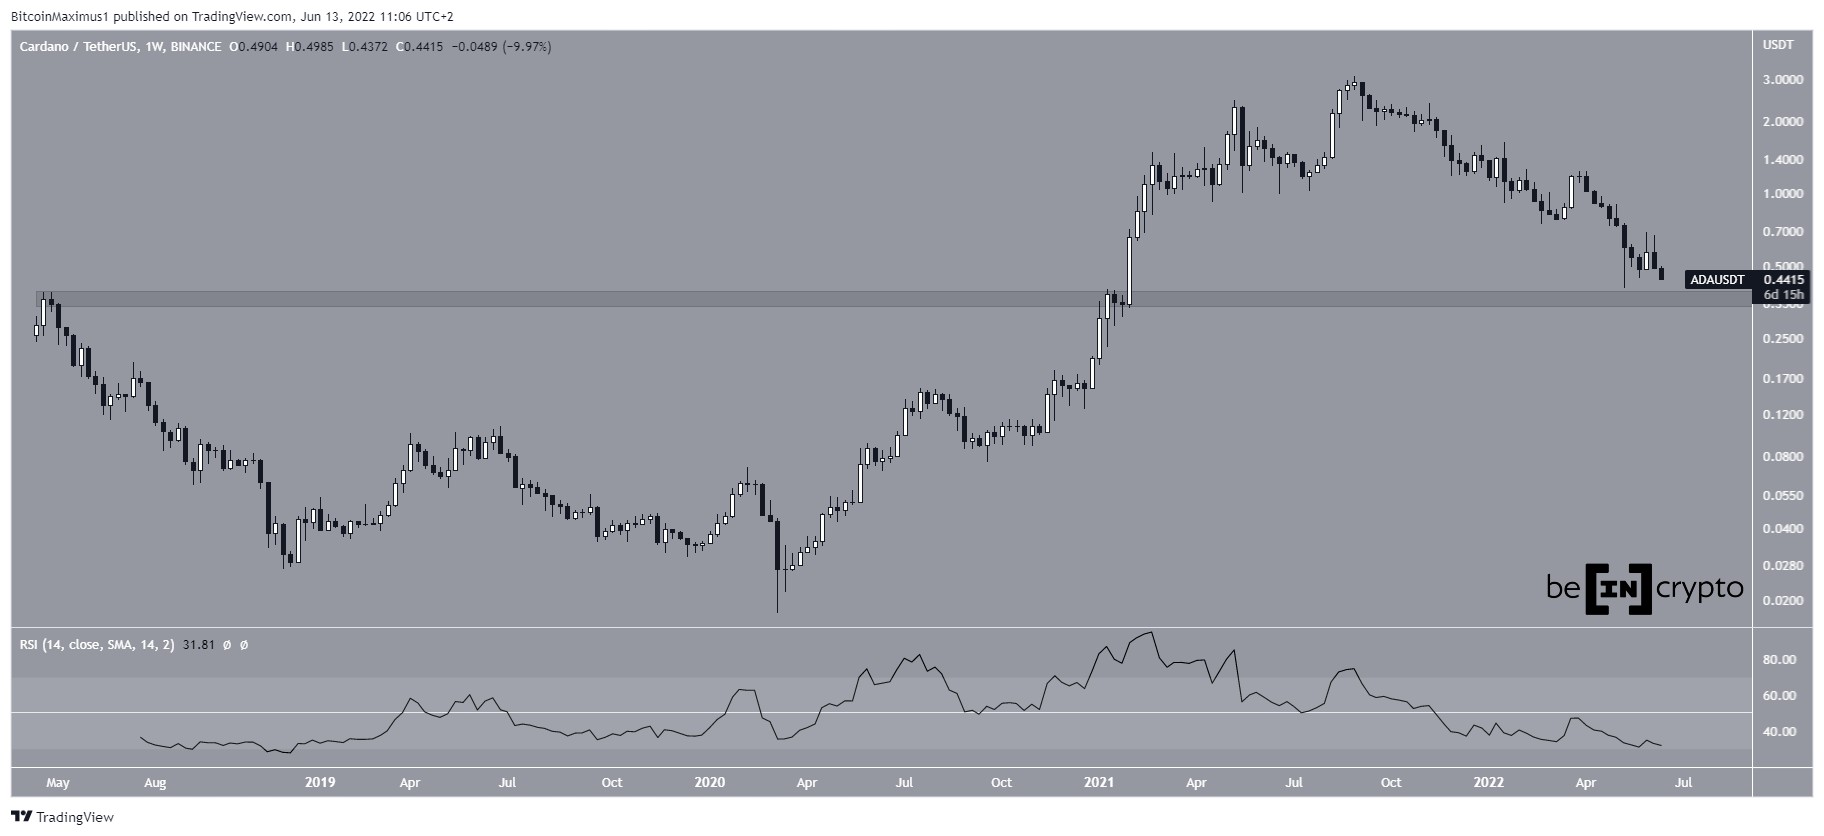
Cardano (ADA) has been falling inside a corrective pattern since reaching an all-time high in Sept. 2021. There are no bullish reversal signs in place yet. The post Cardano (ADA) Tumbles 85% From All-Time High as Market Falters appeared first on BeInCrypto.
2022-6-14 17:00 | |
|
|
Ethereum is showing positive signs above $1,720 against the US Dollar. ETH could start a strong increase if there is a clear move above the $1,850 resistance. Ethereum remained well supported above the $1,720 support zone.
2022-6-9 08:08 | |
|
|
Kusama is on 25% rise after showing some reversal signs
2022-6-1 18:41 | |
|
|
Sideways crypto price action persists as the Federal Reserve confirms its plan to continue raising interest rates, but analysts spot a silver lining.
2022-5-26 01:00 | |
|
|
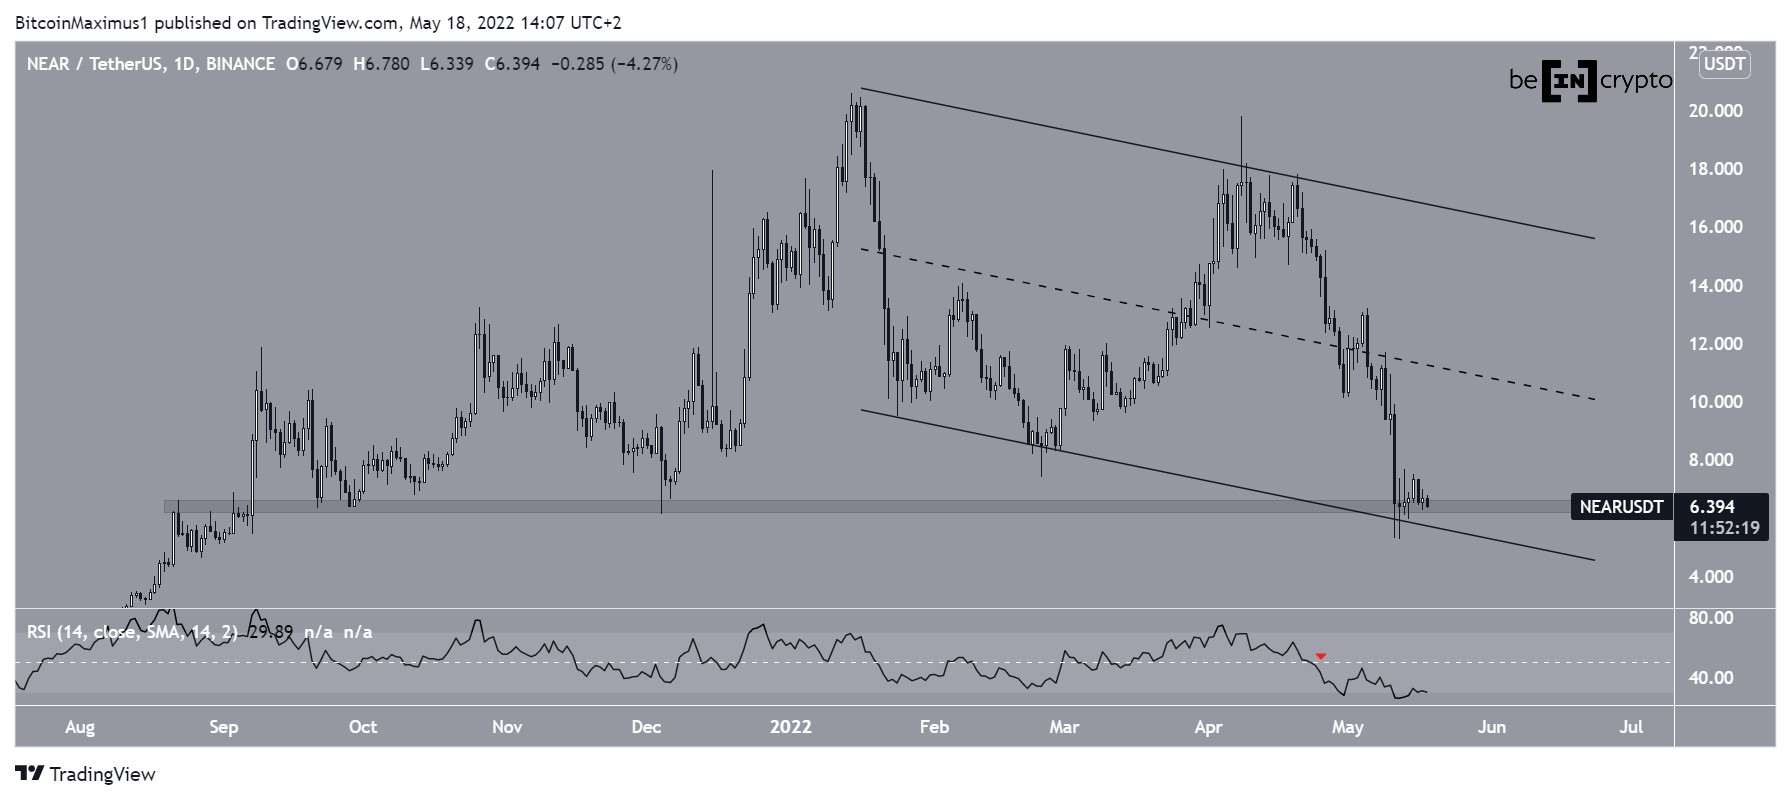
Despite bouncing at a confluence of long-term support levels, technical indicators for Near Protocol (NEAR) do not show any bullish reversal signs. The post Make or Break as Near Protocol (NEAR) Holds on at Support of Long-Term Channel appeared first on BeInCrypto.
2022-5-19 21:30 | |
|
|
After breaking down from a multi-year trendline, Tezos (XTZ) has yet to generate any signs of a potential bullish reversal. The post Tezos’ (XTZ) Daily RSI Drops To New All-Time Low appeared first on BeInCrypto.
2022-5-16 13:30 | |
|
|
Binance Coin (BNB) is approaching a long-term support level close to $280 but has yet to show any clear bullish reversal signs. The post Binance Coin (BNB) Breaks Down From 348-Day Support Line appeared first on BeInCrypto.
2022-5-11 20:30 | |
|
|
IOTA has broken down from a horizontal support area that had previously been in place for more than 300 days. There are no bullish reversal signs in the long- or the medium-term. The post IOTA Drops to New Yearly Low as $0.
2022-5-4 02:00 | |
|
|
Cardano price shows signs of coming around after months of downtrend. The four-hour chart shows that ADA has formed a bottom reversal pattern suggesting a reversal in trend. Therefore, investors neThe post Cardano: This new bullish pattern holds big promise for a recovery to $1 appeared first on AMBCrypto.
2022-3-20 22:30 | |
|
|
Sandbox's price registered gains of 1.75% over the last 24 hours, showing signs of heading higher after setting up a bullish reversal pattern on 21 February. In fact, on-chain metrics seemed to indicaThe post How 'quick' might a 'quick' move for SAND be appeared first on AMBCrypto.
2022-3-14 17:00 | |
|
|
Bitcoin started a downside correction and traded below $42,000 against the US Dollar. BTC must stay above $40,000 to avoid a trend reversal. Bitcoin started a fresh decline below the $43,000 and $42,000 levels.
2022-3-4 06:08 | |
|
|
The Quarkchain (QKC) price has been decreasing since June 22. However, it has reached an important support area and has shown numerous reversal signs, suggesting that the price might soon begin to move upwards.
2020-7-7 09:05 | |
|
|
The Bitcoin dominance rate (BTCD) has broken down from a minor support area. The closest support area is found at 64. 2%, but BTCD has yet to show any signs of reversal. Ongoing Decline The Bitcoin dominance rate has been decreasing since reaching a high of 66.
2020-7-7 17:34 | |
|
|
The DASH (DASH) price has been decreasing alongside a descending resistance line since April 29. While the DASH/BTC pair has shown some signs of a reversal, there are no such signs visible on the DASH/USD chart.
2020-7-4 10:30 | |
|
|
Bitcoin has already seen a strong reversal from the highs seen earlier this week. As of the time of this article’s writing, the flagship cryptocurrency trades at $9,200. This comes after it fell as low as $8,950 during a flash sell-off on Wednesday, with the price being depressed by a leveraged-long liquidation event. Unfortunately for […]
2020-6-25 13:00 | |
|
|
The Bitcoin price has been decreasing since June 1, but today it showed signs of a reversal by breaking out from a short-term descending resistance line. It is possible that this move takes the price all the way to $10,000.
2020-6-23 08:42 | |
|
|
After a long period of consolidation, OmiseGO (OMG) is in the process of breaking out. Ravencoin (RVN) is still in its own consolidation period but has shown several reversal signs. Ravencoin (RVN) The Ravencoin price has been decreasing since reaching a high on April 26.
2020-6-23 19:30 | |
|
|
After showing strong signs of a long-term reversal, the LOOM price has broken out from a major resistance. This could be the first step of a more significant move upwards. RLC has already broken out from a long-term descending wedge and has begun to move upwards.
2020-6-19 17:46 | |
|
|
The IOTA price has been consolidating near 2000 satoshis since August 2019. The price has been showing strong signs of a reversal, indicating that a bullish trend may soon begin. Weekly Analysis The weekly chart for IOTA reveals that the price has been decreasing since September 2018.
2020-6-18 23:15 | |
|
|
The prices of both ICON (ICX) and Hedera Hashgraph (HBAR) have been correcting over the past two months. While both have halted their decline, ICX is showing stronger signs of reversal. ICON (ICX) The ICX price has been declining since April 1, when it reached a high of 4265 satoshis.
2020-6-16 19:00 | |
|
|
The Bitcoin dominance rate (BTCD) has steadily decreased alongside a descending resistance line from May 14. The price is showing short-term reversal signs, but the trend remains bearish as long as BTCD is below this line.
2020-6-5 00:22 | |
|
|
The Bitcoin dominance rate (BCD) has fallen to a major support level, a breakdown below which could indicate a bullish period for altcoins. However, both LTC and XRP have fallen below almost year-long support levels and have yet to show clear signs of reversal.
2020-5-27 20:20 | |
|
|
Theta Token (THETA) has broken out above an important resistance level and validated it as support afterwards. RVN has yet to break out but is showing strong signs of a reversal. Ravencoin (RVN) Cryptocurrency trader @IncomeSharks outlined an RVN chart in which the price is exiting his buy zone, which is found at 200 satoshis.
2020-5-21 00:15 | |
|
|
OGN and COS are showing signs that their long-term downward trend may be nearing its end. Even though ETC and VIBE show similar price action, the chances for a reversal are not as strong. With the consistently increasing Bitcoin dominance rate, altcoins are naturally falling to their lowest levels when looking at their BTC pairs.
2020-5-19 04:20 | |
|
|
During the ongoing Bitcoin (BTC) rapid increase, many ALT/BTC pairs have fallen near their all-time lows. In this article, we will take a look at two of them, which have been showing some signs of a reversal.
2020-5-15 02:15 | |
|
|
On May 10, the Ethereum price broke down from an ascending support line that had been in place for 58 days. However, it has been showing short-term signs of a reversal. The breakdown transpired after a rapid drop that began on May 10 and caused the price to decrease by 14% in a single day.
2020-5-11 23:15 | |
|
|
Ripple is currently consolidating above the $0. 2100 support against the US Dollar. XRP price is showing bearish signs, but it could start a fresh increase as long as it is above the 100 SMA (H4).
2020-5-7 08:58 | |
|
|
Bitcoin failed to surpass the $7,200 resistance and declined below $7,000 against the US Dollar. BTC price is showing a few bearish signs, but the bulls are likely to protect $6,555. Bitcoin is declining and trading below the $7,000 support zone against the US Dollar.
2020-4-21 06:28 | |
|
|
The ATOM price has been trading inside a descending channel since Dec. 15, 2019. While the price bounced on its support line on March 1, it has yet to show clear signs of a reversal and a possible breakout.
2020-3-8 15:15 | |
|
|
Technicals for both the EOS/USD and EOS/BTC pairs show signs of a bullish trend at risk of reversal. Both pairs are now below the 200-day EMA following a Golden Cross and remain above the daily Cloud.
2020-3-5 14:01 | |
|
|
Trader and analyst CryptoBull, who is enthusiastic about Bitcoin (BTC) performance prospects, outlined seven points that can prove a bullish reversal of the BTC market
2020-2-19 21:35 | |
|
|
Bitcoin started a sharp increase above $9,800 and $10,000 against the US Dollar. BTC is currently consolidating and it could soon rally above $10,200 for the next bullish wave. Bitcoin price is showing positive signs above the $10,000 pivot level against the US Dollar.
2020-2-19 08:28 | |
|
|
Both the OmiseGO (OMG) and Waves (WAVES) charts show long-term signs of a reversal. If they reach their targets, both would represent increases of close to 100% measuring from the current price. Altcoin trader @AltcoinSherpa tweeted two images showing a WAVES and OMG chart respectively, both showing the price breaking out from a long-term range.
2020-2-19 08:18 | |
|
|
The Bitcoin (BTC) price has started a new week with a new fall, trading close to a 10-day-low. However, some traders are seeing signs of an upcoming bullish reversal.
2020-2-18 17:48 | |
|
|
At just over a year old, GRIN inflation remains higher than most, if not all, cryptocurrencies in an effort to distribute the coin as widely as possible. However, there is a multi-month double-bottom chart pattern, paired with a reversal of trend metrics, adding to nascent bullish confluence.
2020-2-10 14:01 | |
|
|
EOS appears to have reached an exhaustion point after a significant bullish impulse that saw its price rise by nearly 90%. Now, this cryptocurrency could be bound for a steep correction before continuing upwards.
2020-1-16 14:04 | |
|
|
Bitcoin’s recent volatility has extended into today, with the cryptocurrency seeing massive volatility this afternoon when bulls attempted to push BTC back to $8,000, which was a movement that ultimately resulted in yet another rejection.
2020-1-10 04:32 | |
|
|
Bitcoin has been on an absolute tear over the past few days, surging by some 20% from the $6,900 low put in last week. While some say it is too early to tell whether or not this jump marks an end to the brutal bear market that brought BTC from $14,000 to $6,400 at its... The post appeared first on NewsBTC.
2020-1-8 10:02 | |
|
|
The LINK price has been decreasing since November 14, 2019. It has reached a significant support area and is showing signs of a reversal. The LINK price has been increasing since 2017. However, it has seemingly approached a make-or-break support level, a decrease below which would indicate that the upward trend has ended.
2020-1-8 05:11 | |
|
|
The XRP price has been correcting the entire year. While it showed some signs of a reversal in September, the rally lost its power and the price has retraced fully. The price has reached a significant support area, which is possibly a make-or-break level for the bullish outlook to remain intact.
2019-12-29 03:21 | |
|
|
Earlier this month, Bitcoin (BTC) plunged as low as $6,400, marking a new multi-month low for the leading cryptocurrency. But as fast as the crypto dropped, it reversed, with BTC surging to $7,700 just last weekend on the back of bulls looking to buy in the $6,000s.
2019-12-28 01:00 | |
|
|
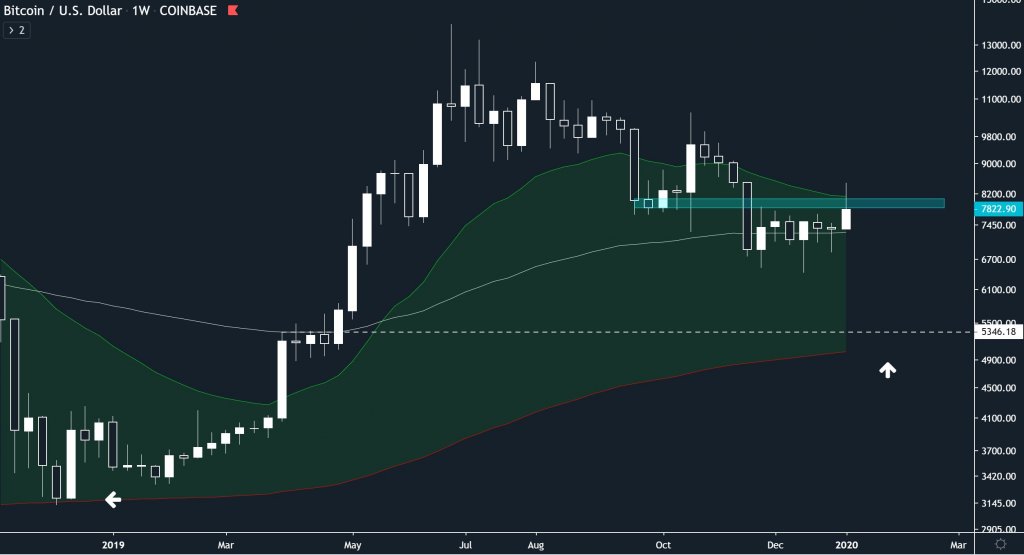
Bitcoin price is showing signs of a macro trend reversal but another dip to $6.8K shouldn’t be ruled out
2019-12-24 19:22 | |
|
|
The Ethereum Classic price has fallen to an all-time low but has shown several strong reversal signs. We believe that a new market cycle will begin in the near future. The Ethereum Classic (ETC) price has been correcting since the beginning of August when it initiated an upward move.
2019-12-24 07:04 | |
|
|
Overnight, the bitcoin price rose to as high as $7,642 and is up by more than $1,200 within five days. With the reversal, the dominant cryptocurrency crucially avoided miner capitulation and retest of an ascending channel dating back to 2015.
2019-12-23 12:43 | |
|
|
Ethereum is climbing higher and trading nicely above the $130 level against the US Dollar. The price is likely to continue higher once it surges above the $150 resistance. There is a rising channel forming with support near $133 on the hourly chart of ETH/USD (data feed via Kraken).
2019-12-23 06:14 | |
|
|
Bitcoin cash price is showing recovery signs from the $170 monthly low against the US Dollar. The price is currently consolidating above the $180 and $182 support levels. There is a key bearish trend line forming with resistance near $190 on the hourly chart of the BCH/USD pair (data feed from Kraken).
2019-12-19 12:00 | |
|
|
Ethereum is up more than 8% from the recent low of $115 against the US Dollar. The price is showing signs of a trend reversal, but it must surpass $135. Earlier, there was a break above a connecting bearish trend line with resistance near $122 on the hourly chart of ETH/USD (data feed via Kraken).
2019-12-19 06:08 | |
|
|
The Bitcoin price has been decreasing since October 25. Both the long- and the short-term analyses suggest that the price will soon make a bottom and begin a reversal. The market has been bearish throughout November/December, especially since the Bitcoin price broke down below $7000.
2019-12-18 18:59 | |
|
|
The Bitcoin and altcoin market caps have been decreasing since June. Both have reached significant support areas and have shown signs of initiating a reversal. The Bitcoin price has been relatively stable over the past three weeks.
2019-12-11 06:42 | |
|
|