2018-8-13 18:38 |
Week over week, Bitcoin prices are down eight percent and this is better than last week’s when it printed a 13 percent drop following that strong rejection of $8,500. Going forward, Bitcoin prices are at a precipice and simply hanging by the thread once again retesting our support zone at $6,000.
Overly we remain bearish and all we need are price jolting coin specific news as SEC approving Bitcoin ETF to reverse these gains. If not, then we are leaning towards bears in days to come.
News HighlightsIt doesn’t matter your technological stand and whether you are into the idea of cryptocurrencies replacing fiat. What is very clear is that Bitcoin is taking a hit and as it does, its dominance within this crypto space continue to balloon.
Thus far, Bitcoin dominance stands at 51 percent and this usually happens when there is a clip on altcoins following Bitcoin price dips as we saw last week. Anyway, what dominated the headlines was news of the SEC delayed VanEck Bitcoin ETF. Many said that investors “overreacted” and what we saw shortly was a double digit loss in Bitcoin driving back prices to around $6,000 our main support line.
However, while many remain optimistic and seeing Bitcoin prices bouncing off these near 2018 lows, do you think coin specific news would spur these gains? Well, first the approval of Bitcoin ETF will undoubtedly usher in the next wave of buy pressure and high net worth individuals might stake in higher amounts feeding the buying frenzy.
We don’t have the specific dateline of when this hallmark announcement will be made but once it does happen and rumors spill out that the SEC will approve the Bitcoin ETF with near certainty will fuel a comeback thrusting prices above $7,000 for the second time in three weeks. On the flip side, another rejection by the SEC following their momentum reducing delay would probably see Bitcoin prices testing $4,500 and $3,000 as highlighted in our last Bitcoin (BTC) trade plans.
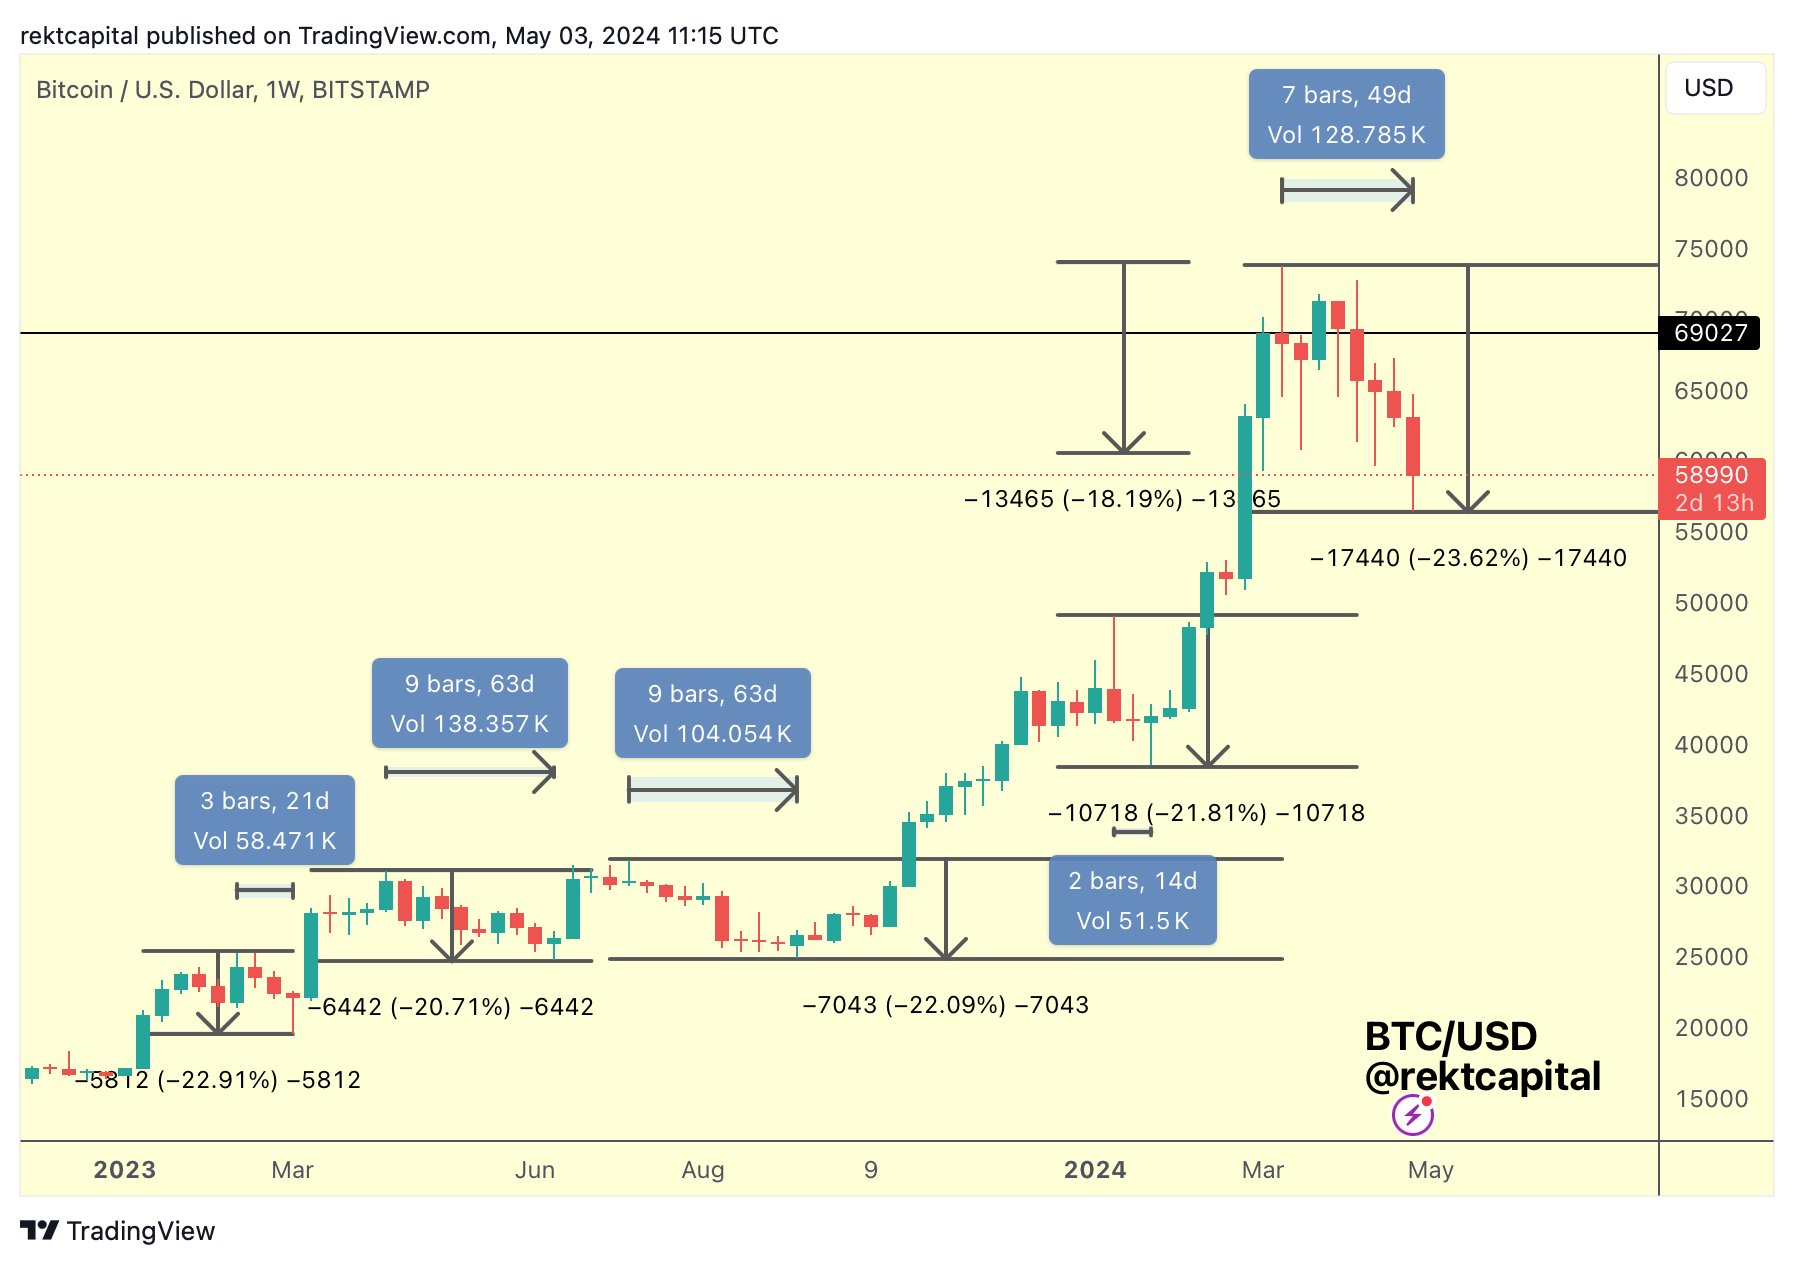
Technical Analysis Weekly chart Click here to see the full Bitcoin Weekly Chart by Trading ViewIn this time frame, it’s obvious that sellers are in charge. After all, they have been in control for the last eight months when prices peaked in mid-Dec 2017. At current levels, Bitcoin are moving inside a descending triangle with strong supports between $5,800 and $6,000.
Besides, with the horizontal consolidation of the past two to three months prices are now approaching the apex of that descending triangle with decreasing momentum as that negative sloping resistance trend line shows.
Now, since bears are in charge as mentioned, we shall be inclined to sell and perhaps capitalize on the last two weeks price action. However, for that to happen and especially for those who missed out on that slide from $8,500, we need convincing high volume close below $5,800-the lower limit of our support zone before we suggest unloading on every pull backs in lower time frames.
First targets will be at $4,500 and later $3,000. On the flip side, any gains above the resistance trend line and $7,000 would usher in Bitcoin bulls targeting $10,000.
Daily Chart Click here to see the full Bitcoin Daily Chart by Trading ViewHere, we can see rejection of lower lows right at $7,000-the upper limit of our buy zone. Regardless, prices are still held within Aug 10 high volume bear candlestick and in that case, there is no need for optimism from Bitcoin bulls.
The only time we shall initiate a trade is when we see sellers pressing lower and closing below 2018 lows at $5,800 or when there is injection of bull momentum pushing prices above $6,800 and $7,000.
As such, before any of that happens, I recommend staying neutral with a bearish skew. After all, we are in a deep bearish stand.
EOS, Ethereum, XRP, Monero, Bitcoin Cash Technical Analysis August 13th
Disclaimer: Views and opinions expressed are those of the author and aren’t investment advice. Trading of any form involves risk and so do your due diligence before making a trading decision.
origin »Bitcoin price in Telegram @btc_price_every_hour
Bitcoin (BTC) на Currencies.ru
|
|