2021-12-7 19:03 |
In this article, BeInCrypto will take a look at the potential wave count for Bitcoin (BTC), after the sharp fall of Dec 4.
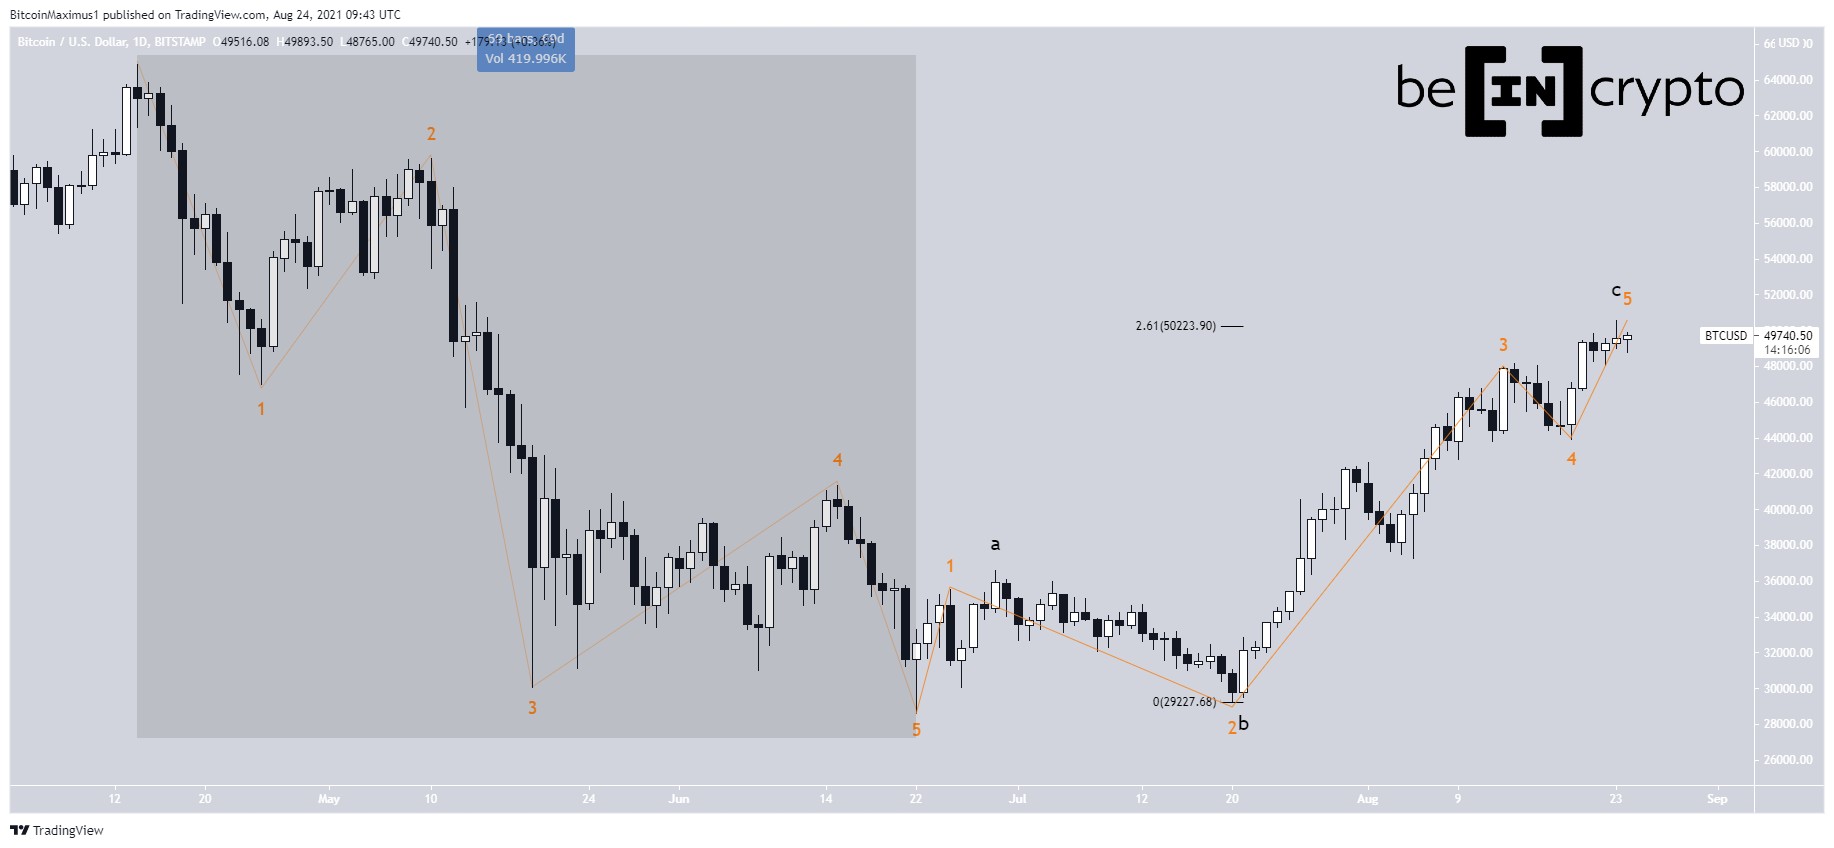
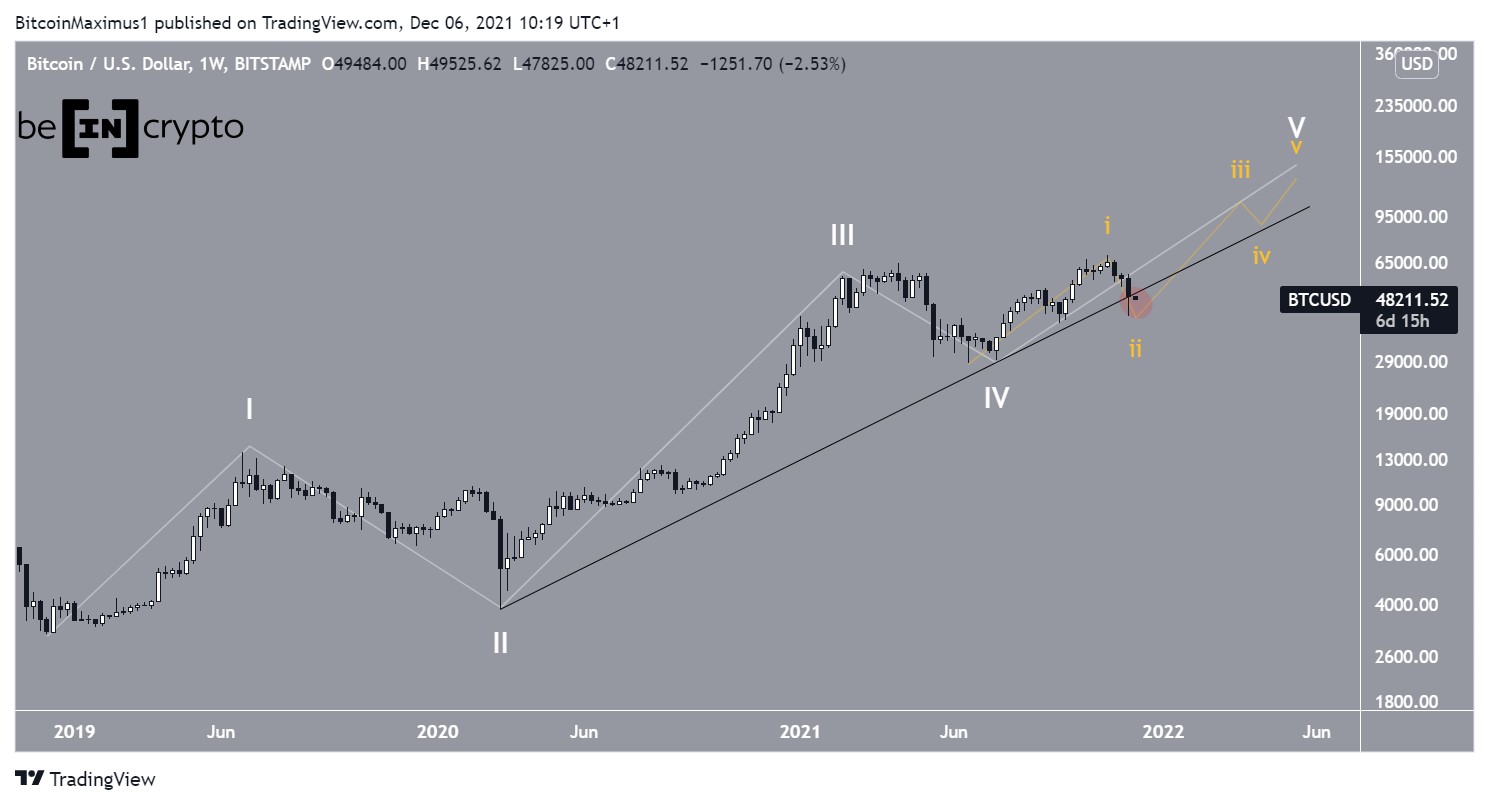
Long-term BTC countsThe main wave count suggests that BTC is in wave five (white) of a five wave bullish impulse. A bullish impulse is a five wave movement, in which three waves are upwards, while two are downwards, and are considered corrective.
Therefore, this is the final upward movement prior to a significant correction. The entire upward movement began on Dec 2018, when the BTC price was at $3,122.
The sub-wave count is given in yellow, and shows that BTC is still in sub-wave two (yellow). Therefore, if the count is correct, there is still considerable room for the price to grow.
The only issue with this count is the fact that the trendline connecting waves 2 and 4 is nearly broken (red circle). According to Elliott wave theory, the trendline should stay in place for as long as the upward movement is intact.
Therefore, for the count to remain valid, BTC has to reclaim this trendline and stay above it.
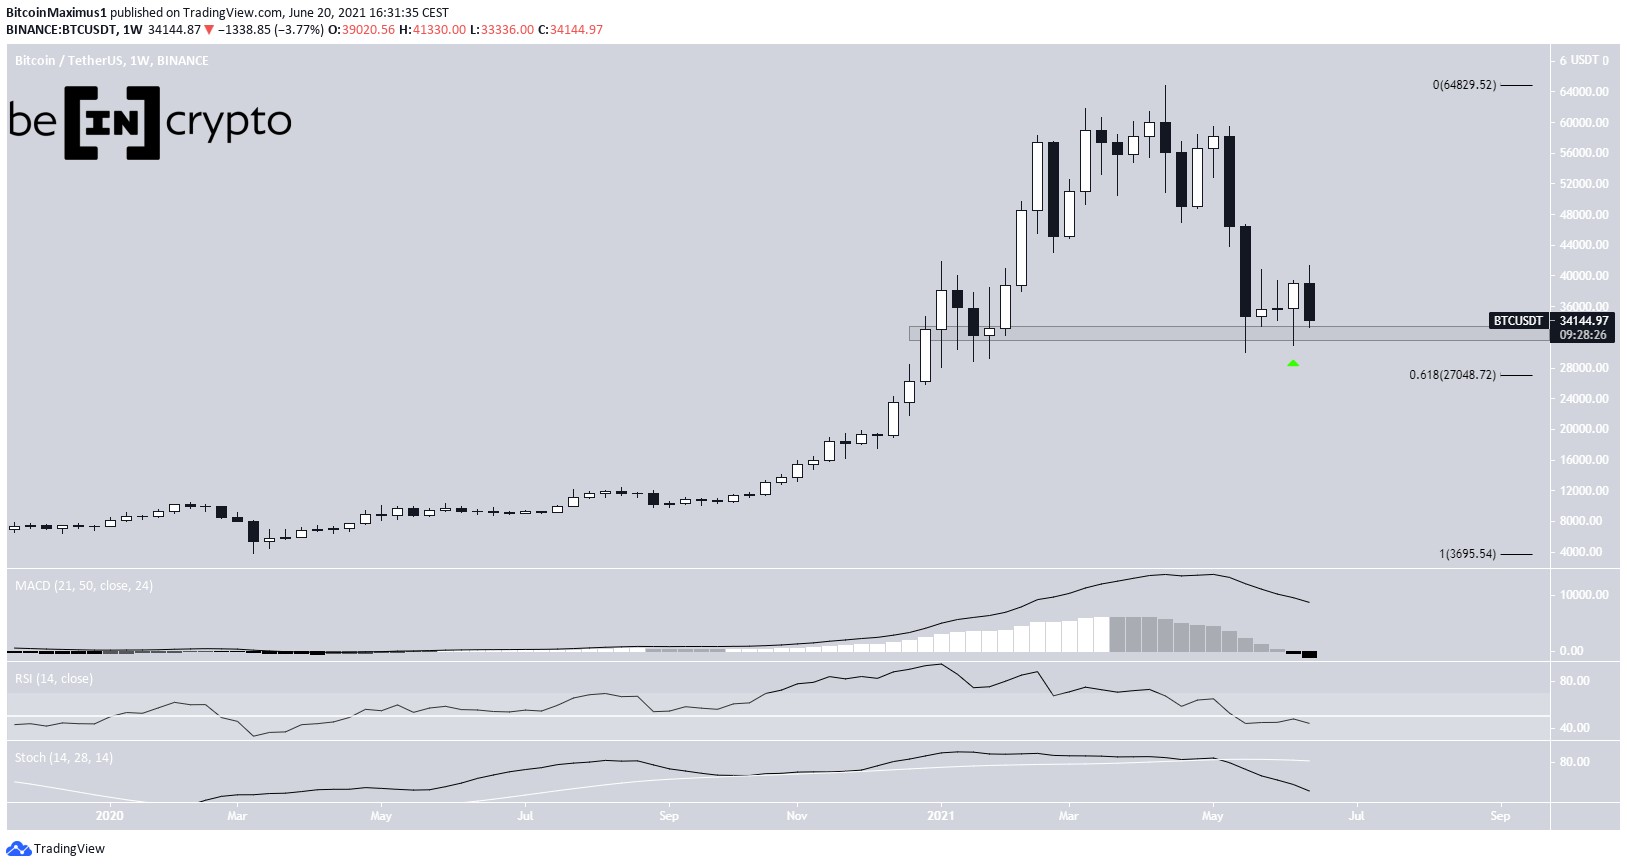
Chart By TradingViewThe alternate count, which is more bearish, suggests that BTC is still in wave four of the same five wave upward movement (white). In this case, it would continue the decrease towards $30,000, before eventually beginning another upward movement towards a new all-time high, which would complete the bullish impulse.
The only issue with this count is the large discrepancy between sub-wave two and four (highlighted). While they should have some alternation between them, the fact that sub-wave four is nearly seven times longer than sub-wave two is extremely unusual.
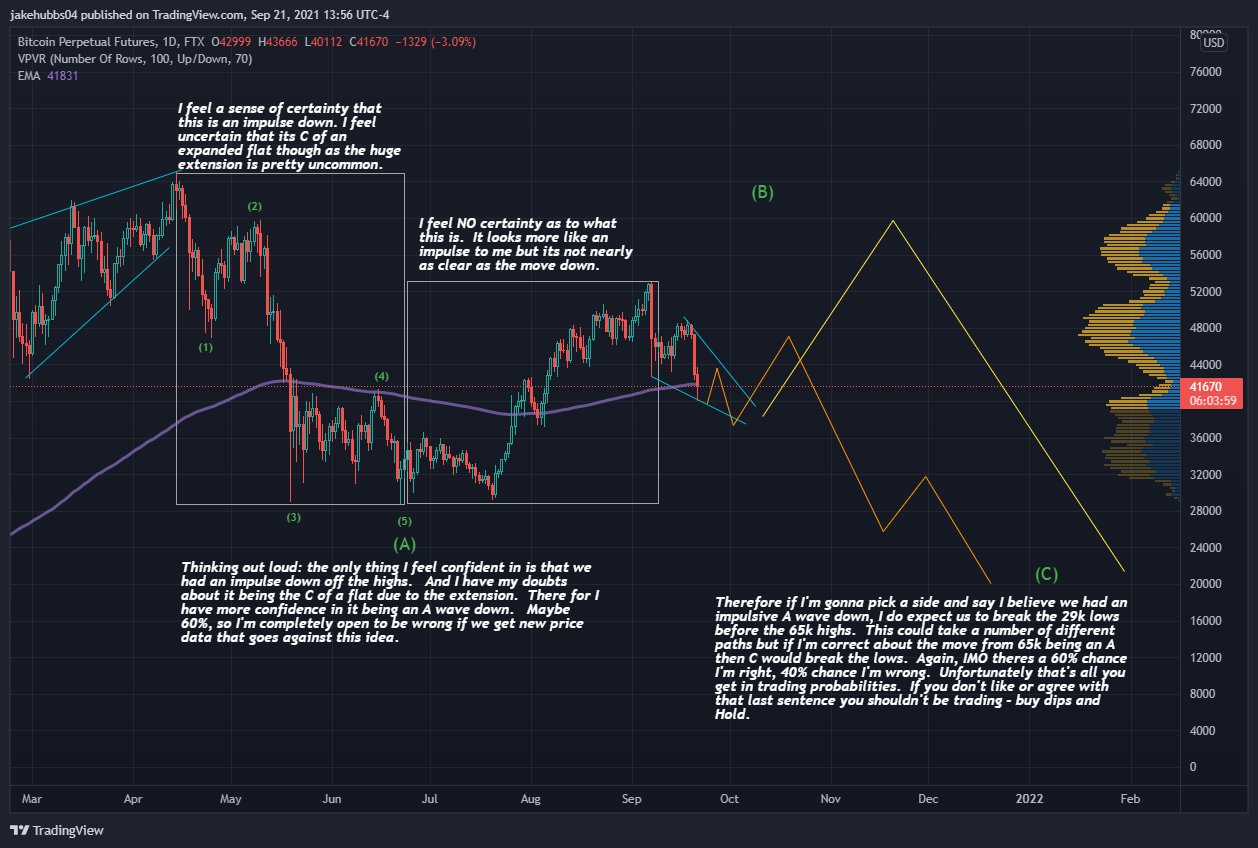
Chart By TradingView Short-term countCryptocurrency trader @TheTradingHubb outlined a BTC chart, which shows the price correcting towards $42,000.
Source: TwitterSince the tweet, BTC reached the target and bounced. However, due to the length of the preceding increase, it does not seem likely that the entire corrective structure is complete. Rather, this could be only the first part of the correction prior to another drop (black).
In order for the bullish count to remain valid, BTC has to hold on above the $37,100 area. This is the 0.786 Fib retracement support level and a horizontal support area.
A decrease below it would make the previously outlined bearish count as more likely.
Chart By TradingViewFor BeInCrypto’s latest Bitcoin (BTC) analysis, click here.
The post Analyzing Which is the Most Likely Bitcoin (BTC) Wave Count? appeared first on BeInCrypto.
origin »Bitcoin price in Telegram @btc_price_every_hour
Bitcoin (BTC) на Currencies.ru
|
|