2021-8-25 18:05 |
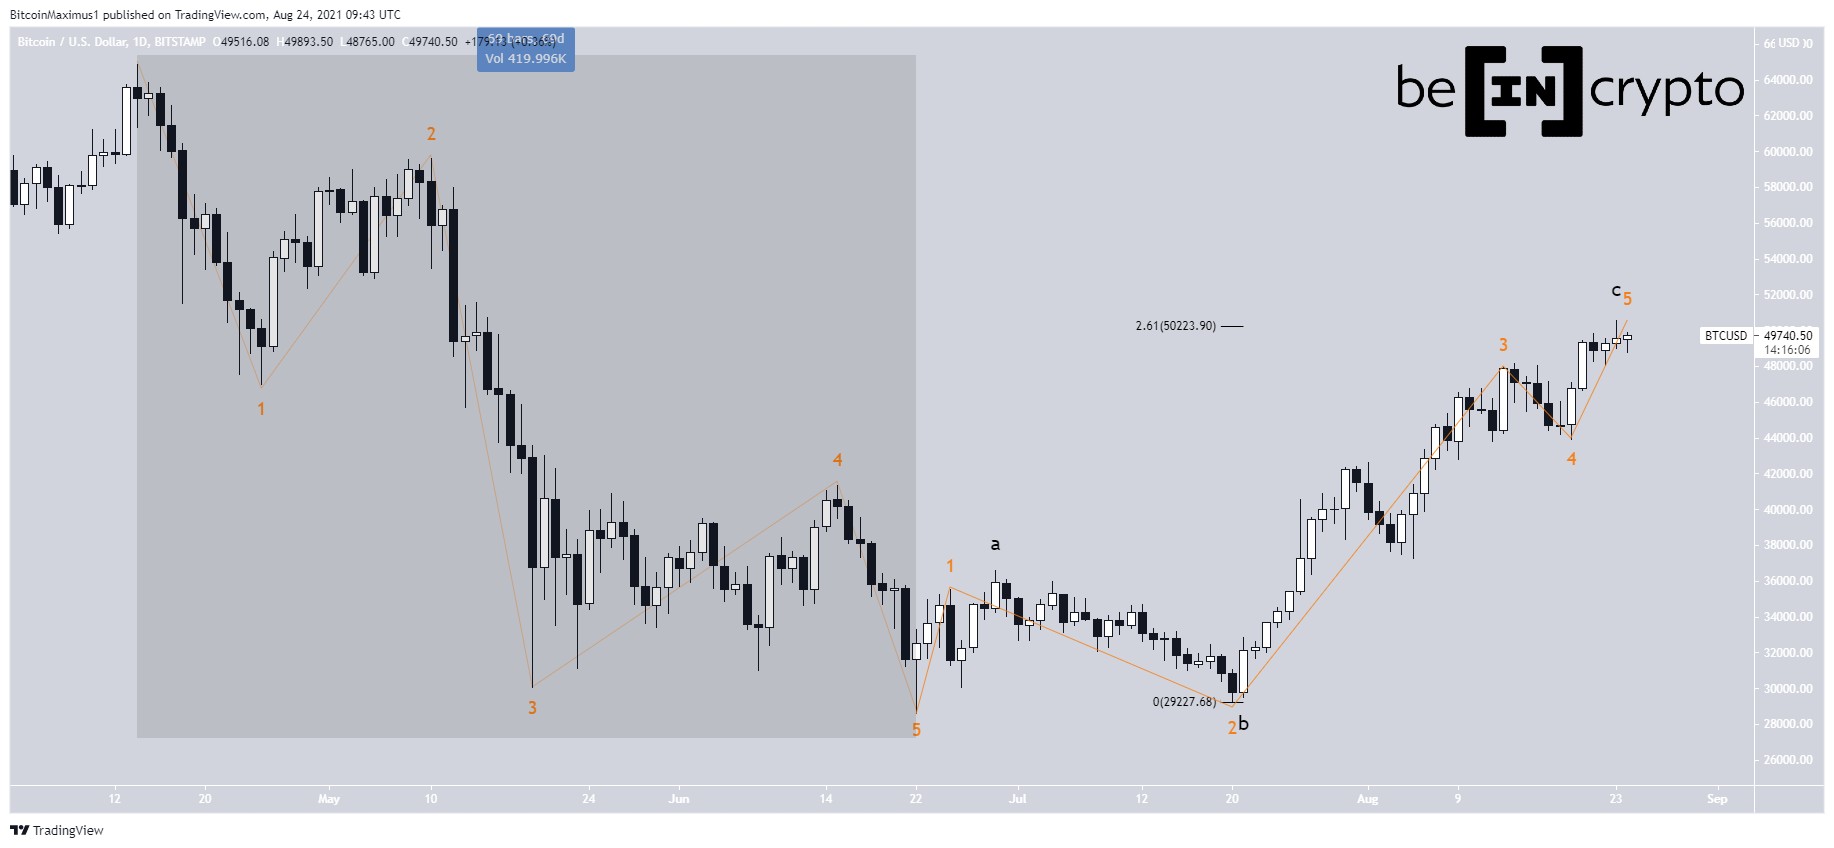
Bitcoin (BTC) seems to be in wave four of a long-term bullish impulse that began on March 2020.
However, the short-term count cannot be accurately determined yet. Whether BTC manages to break out above the $51,200 resistance area will go a long way in confirming the direction of the future trend.
Bearish impulseBTC has been decreasing since reaching an all-time high price on April 13. The clearest part of the count is this aforementioned decrease, which is a five wave bearish impulse.
The move continued for 69 days and ended on June 22.
What remains undetermined is whether the ensuing bounce is an A-B-C corrective structure (black), or if it is a new bullish impulse (orange).
The issue with the impulse is its extremely unusual shape. On the other hand, the corrective structure has waves A:C with a 1:2.61 ratio, which is the upper limit for such structures.
Furthermore, a continued increase would invalidate this possibility, since it would mean that wave C is more than 2.61 times longer than wave A.
For the previous wave count analysis, click here.
Chart By TradingView Long-term countCryptocurrency trader @CredibleCrypto outlined a BTC chart, in which the price is in wave four of a bullish impulse and will increase towards $55,000.
Source: TwitterIn the long-term, it does indeed seem that BTC is in wave four (red) of a bullish impulse that began on March 2020. However, it is not certain if wave four has ended or if there is another low to come.
Due to EW rules, waves two and four should have sufficient alternation between them. The proposed waves two and four are different with each other, thus not breaking EW rules.
However, it is interesting to point out that wave four has yet to even reach the 0.382 log Fib retracement level. Therefore, it is extremely shallow, even by wave four standards.
Another lower low that would tag the 0.382 Fib retracement support level would also complete a fourth wave pullback.
Chart By TradingView Future movementThe short-term future count is still unclear. Firstly, the proposed triangle does not seem likely due to the fact that the decrease is a five wave structure instead of a three wave one.
Chart By TradingViewTherefore, if the movement is still part of wave four, the most likely scenario would have BTC getting rejected at the $51,200 area. This would lead to another lower low and would complete the aforementioned fourth wave pullback.
Chart By TradingViewOn the other hand, the bullish count would indicate that wave four has ended, with the outlined five wave decrease (orange) being part of the C wave of an A-B-C structure.
Therefore, whether BTC gets rejected or breaks out above the $51,200 area will go a long way in determining the direction of the future movement.
Chart By TradingViewFor BeInCrypto’s latest Bitcoin (BTC) analysis, click here.
The post Outlining Potential BTC Wave Counts appeared first on BeInCrypto.
origin »Bitcoin price in Telegram @btc_price_every_hour
wave edu coin (WEC) на Currencies.ru
|
|