2023-6-16 12:59 |
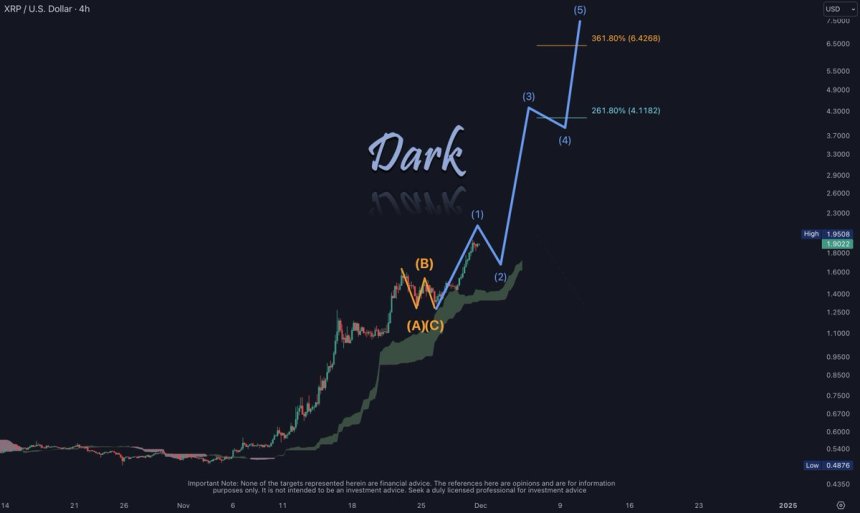
Our analysis of XRP suggests an intriguing period ahead. We propose a strategy of short-term selling for long-term gains.
This approach is based on three key observations:
A recent release of significant emails was expected to act as a catalyst for a price surge. However, this surge did not occur, indicating that the market might not be reacting to news events as expected. We anticipate a substantial drop in prices in the coming weeks. This drop is likely to instill a sense of fear in the market, leading to a state of FUD (Fear, Uncertainty, and Doubt) that hasn’t been prevalent for some time. Our advice is to seize the opportunity during this period of fear. The anticipated drop in prices could present a lucrative buying opportunity for those willing to go against the grain and buy when everyone else is scared.It’s important to remember that in the volatile world of cryptocurrencies, fear and greed often drive the market. By staying informed and making decisions based on careful analysis rather than emotional reactions, investors can navigate these turbulent waters more effectively.
In the first circle from 2017, if the price of XRP experienced a significant increase, it could have been due to the overall bullish sentiment in the crypto market during that year. 2017 was a notable year for cryptocurrencies, with many experiencing substantial growth.
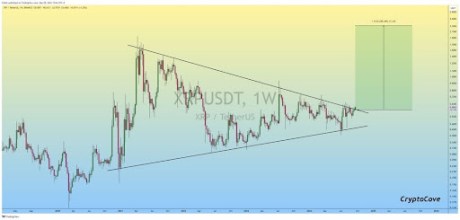
As for the second circle, where XRP is currently priced at $0.47724, future price movements can be harder to predict due to the inherent volatility of the crypto market. However, based on our previous analysis, we anticipate a potential drop in prices in the short term, leading to a state of FUD (Fear, Uncertainty, and Doubt) in the market. This could present a buying opportunity, as prices may rebound in the long term.
Bullish Breakout on the Horizon for LUNCOur analysis of the LUNC/USDT chart indicates a potential bullish trend. A Bollinger Band breakout has been identified, with the price moving outside of the upper Bollinger Band. This movement often suggests a continuation of the current trend.
The next resistance key levels for LUNC are located at 0.00010973, 0.00013191, and 0.00017099. On the other hand, the major support zones can be found at 0.00007065, 0.00005375, and 0.00001467. The current price zone of 0.00009931 could be a good entry point, with targets set at the aforementioned resistance levels.
In terms of technical metrics, the market price is 0.00009931 with a 24-hour volume of 15,546,978.483. The price has seen a change of 3.04% in the last 24 hours, 3.79% in the last 7 days, and 8.46% in the last month. However, the 3-month change shows a decrease of -22.56%.
The technical indicators summary suggests a BUY signal. Oscillators are indicating a SELL, while moving averages are showing a STRONG_BUY. The Sharpe Ratios over different periods show a mixed picture, with the last 30 days at 1.32, indicating a good risk-adjusted return, but the last 90 days and last year showing negative values, indicating higher risk.
The market sentiment index for LUNC is very bullish on Reddit, but no sentiment score is available for news or Twitter.
Potential Bullish Reversal for LINA: A Harmonic Shark Pattern AnalysisOur analysis of the LINA/USDT chart suggests a potential upward movement. LINA experienced a significant pump three weeks ago with strong volume and has since retraced as expected. This retracement is a common occurrence in the market following a strong price surge, as traders take profits and the price adjusts before the next potential move.
Based on the current chart pattern, it’s likely that LINA will bounce from its current position. This prediction is based on a potential shark pattern, a harmonic trading pattern that can signal a reversal. In this case, the pattern suggests a bullish reversal, indicating that the price of LINA could increase from its current level.
The current price of LINA is 0.013637. If the shark pattern plays out as expected, we could see LINA reach new highs in the coming weeks. However, it’s important to monitor the market closely, as price movements can be influenced by a variety of factors, including market sentiment and broader economic trends.
As always, this analysis is based on current market conditions and trends, and the volatile nature of the cryptocurrency market can lead to rapid changes. Always conduct your own research and consider your financial situation before making investment decisions.
The post XRP Price Analysis Suggests Long Trading, LUNC Shows Bullish Signals and Potential Bullish Reversal for LINA appeared first on CaptainAltcoin.
origin »Bitcoin price in Telegram @btc_price_every_hour
Ripple (XRP) на Currencies.ru
|
|