2020-2-29 18:36 |
The ATOM price has been decreasing for the entirety of 2020. It has reached a critical support area, from which it broke out in October 2020.
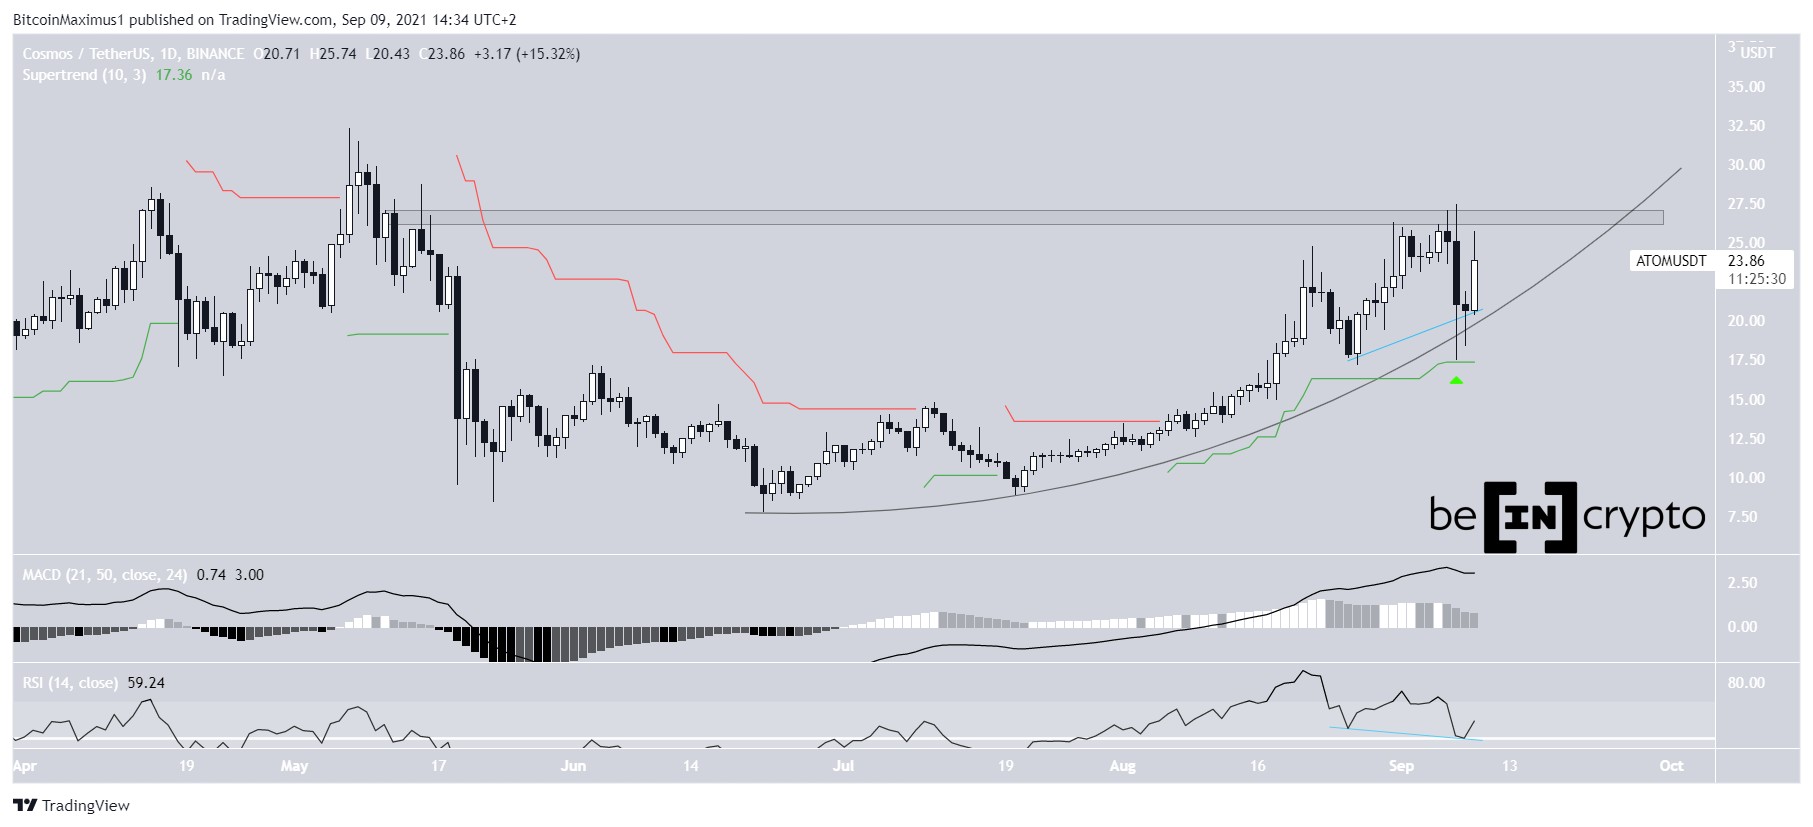
Cosmos (ATOM) Price Highlights The ATOM price is trading inside a descending channel. Technical indicators support a breakout. There is support at 40,000 satoshis. The ATOM price might have just begun the third out of a five-wave Elliott formation. There is resistance at 62,000 satoshis.Bitcoin and altcoin trader @Devchart outlined an ATOM chart that shows the price resting comfortably inside a support area. He proposes to initiate a long-trade with a target of 13 percent above the current price.
$ATOM
1D TF
A little risky one considering $BTC current PA but need to mention it at least.
– Retraced to support
– @ChartAlertsIO alerted of a bullish Divergence on the 4h with support confluence.#ATOM #Alts #Crypto pic.twitter.com/tGVz0BR8yh
— Devchart (Andre) (@devchart) February 28, 2020
Will the Cosmos price bounce towards the target or will it break down below the support area instead? Keep reading below if you are interested in finding out.
Possible ReversalThe ATOM price increased significantly in the latter part of 2019 — more specifically, in the period from September-December 2019. However, it has been decreasing since September 27, when it reached a high of 66,110 satoshis.
It has currently returned to the 40,000 satoshi support area, which also coincides with the 0.618 Fib level of the entire increase — making it a likely place to initiate a reversal.
Descending ChannelThe ATOM price has been trading inside a descending channel since December 15, 2019. The decrease has been gradual, with both the resistance and support lines being validated several times.
The recent two times the price has touched the support line, on February 16 and 27, it created long lower wicks. This indicates that the lower prices are getting bought up quickly and that the buyers are gaining strength.
Just based on this, the price is likely to continue moving upwards towards the resistance line.
The possibility for an upward move and even a breakout is strengthened significantly once we look at the technical indicators, namely the RSI and moving averages (MA).
Besides this being a strong support area, it is also the 200-day MA.
The daily RSI has generated three higher lows while the price has generated three lower highs. This is known as bullish divergence and often precedes a reversal.
Future Cosmos Price MovementFor the long-term, the most plausible possibility remains that this is a five-wave Elliott formation, beginning with the aforementioned increase in the latter part of 2019.
The recent validation of the 4000 satoshi support area marked the end of the second wave.
The third one could go as high as 105,000 satoshis, also reaching an all-time high in the process. A less-ambitions target would be at 83,000 satoshis.
This formation would be invalidated with a breakdown below 40,000 satoshis.
To conclude, the ATOM price is trading inside a descending channel and has reached a significant support area. We believe this area will be successful in reversing the current trend and cause a breakout.
Read More Dogecoin’s Double Bottom Could Lead To Higher Prices The Basic Attention Token (BAT) Price Gradually Moves Towards Resistance Will ATOM’s Crucial Support Area Reverse The Current Trend? Why EOS Could Still Increase by Another 50%The post Will ATOM’s Crucial Support Area Reverse The Current Trend? appeared first on BeInCrypto.
origin »Bitcoin price in Telegram @btc_price_every_hour
Atomic Coin (ATOMIC) на Currencies.ru
|
|