Why a trader says a Bitcoin bottom is close, based on a key technical structure

Why a trader says a Bitcoin bottom is close, based on a key technical structure
фото показано с : cryptoslate.com

2021-1-28 20:15

Scott Melker, a cryptocurrency trader and the author of The Wolf Den Newsletter, believes a short-term Bitcoin bottom is close.

Melker often uses the relative strength index (RSI) indicator on the 4-hour and 6-hour candle chart time frames to identify potential trend reversals.

The RSI is an indicator that is used to evaluate whether an asset is overbought or oversold. If the RSI is over 75, the asset is overbought, and if it is under 30, it is oversold.

Bitcoin not oversold, but the bottom is likely soon

Technically, Melker explained that Bitcoin is not yet oversold, at least on the 6-hour time frame.

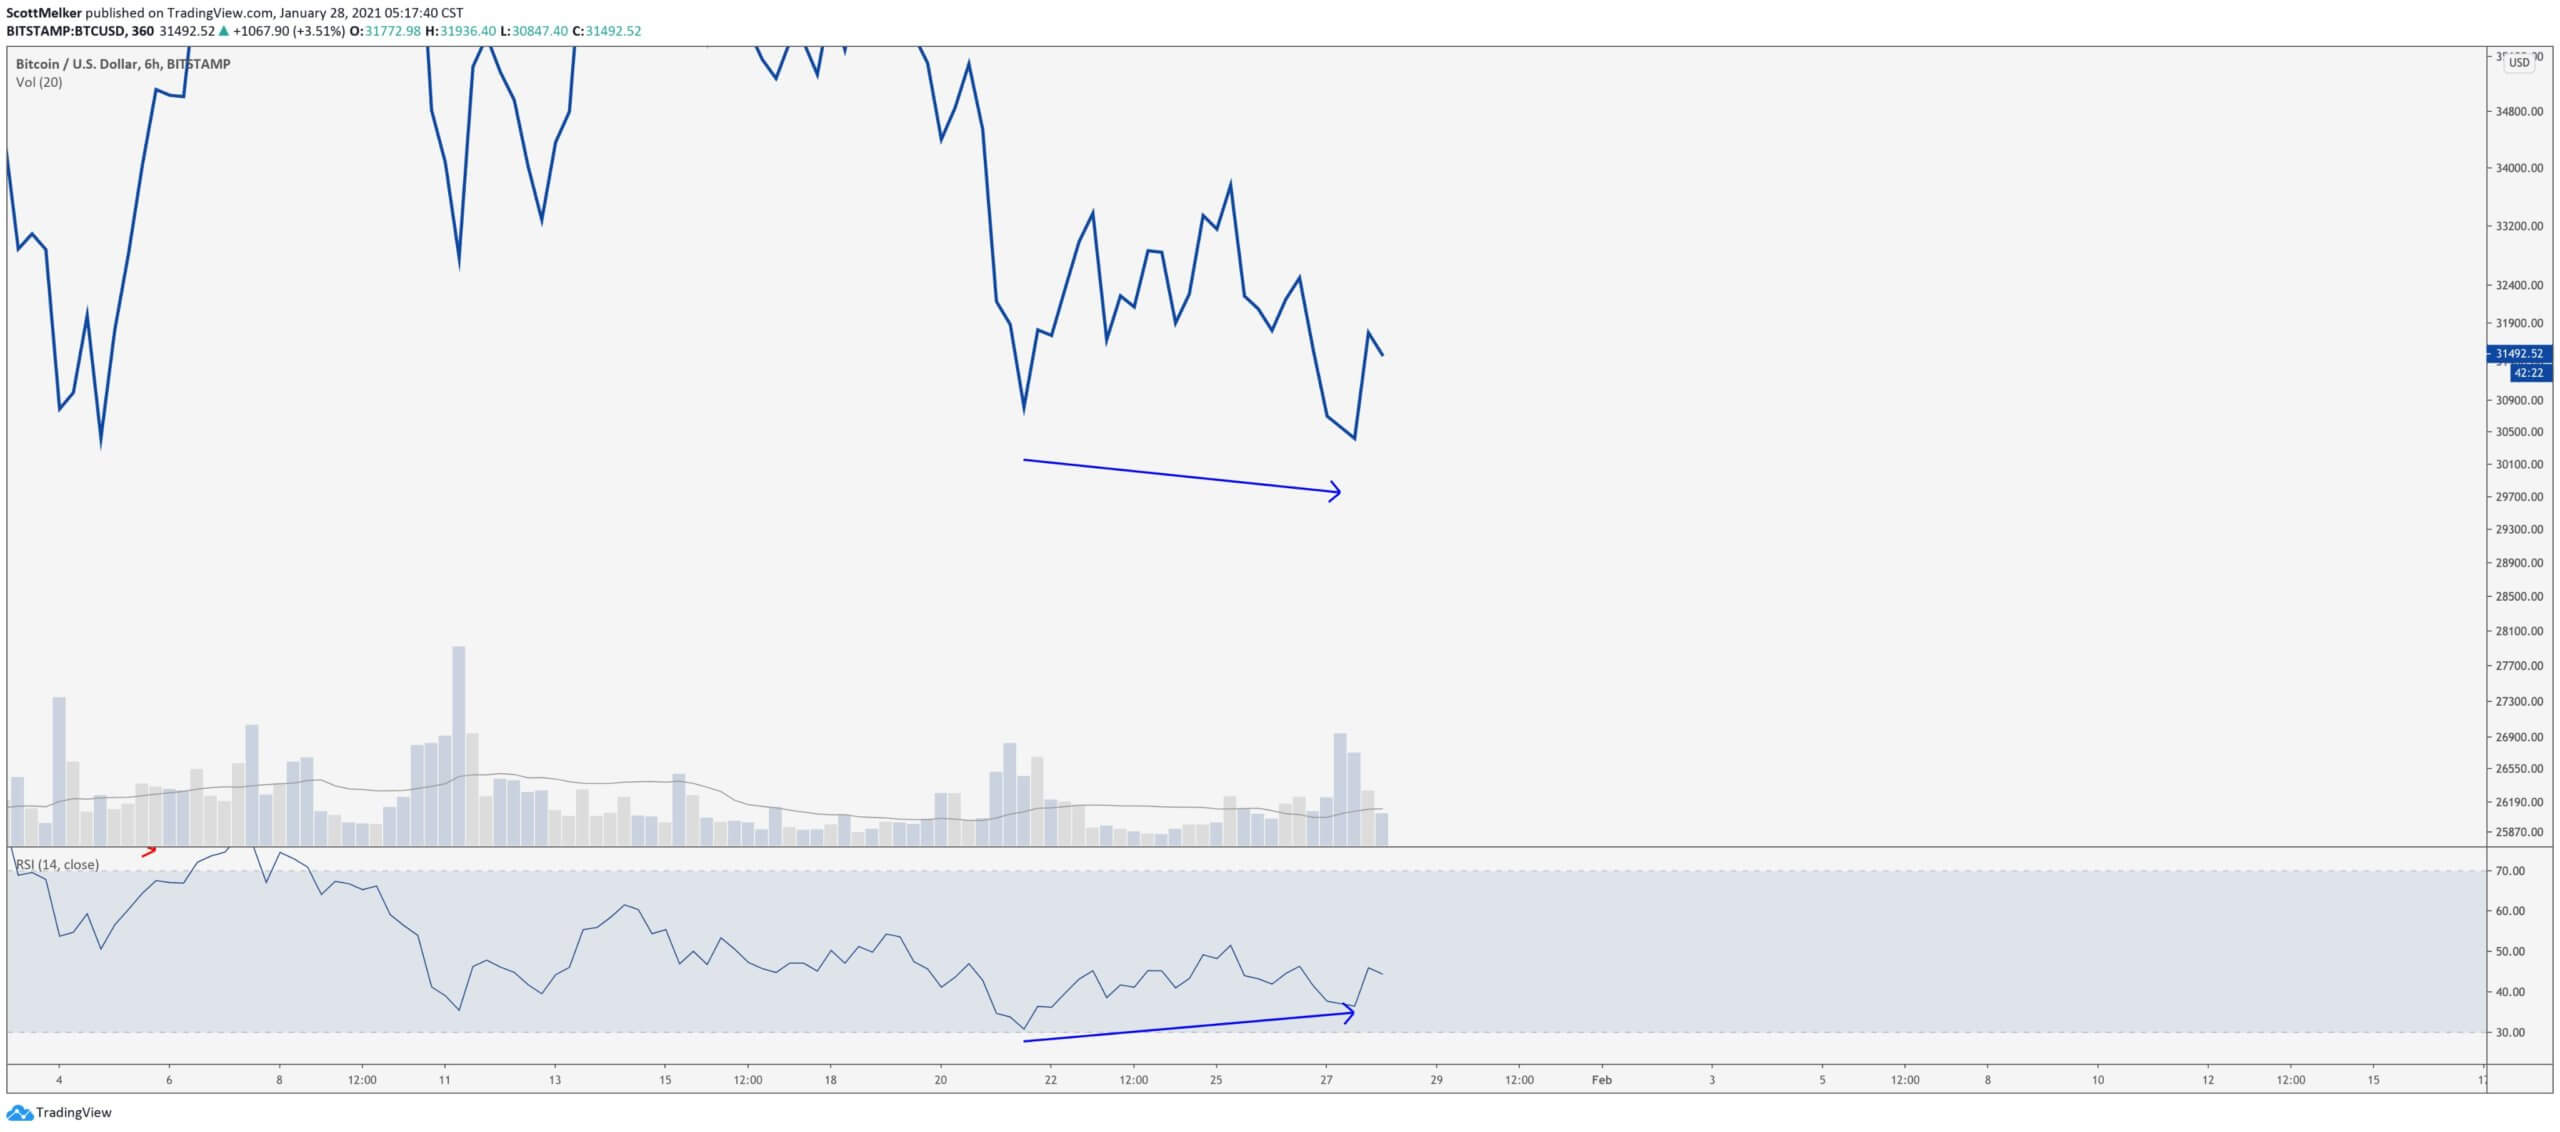
But, a bullish divergence with the RSI has been confirmed, Melker said. The 12-hour candle chart would also soon confirm the same structure, which would be positive for BTC in the near term. He wrote:

“6 hour bull div with RSI confirmed. 12 hour likely to confirm in 40 minutes. We had iffy divs on lower time frames yesterday building to these. Neither reached oversold. Can still drop and make larger div, but bottom ‘should’ be in or close. Should.”

6-hour price chart of Bitcoin. Source: BTCUSD on TradingView.com

There are also fundamental reasons why a short-term Bitcoin relief rally could occur.

First, yesterday, on January 27, the premium of Bitcoin on Coinbase rose significantly, reaching $200 at one point.

Although the price of Bitcoin naturally trades slightly higher on Coinbase than usual, this indicates that high-net-worth investors were aggressively accumulating the dip.

This trend explains the swift trend reversal Bitcoin saw under $30,000, recovering to around $31,000 within several hours.

Whales are likely trying to defend the $30,000 support area from being broken, as breaking below $30,000 would result in a more complex correction.

What happens next?

A pseudonymous trader known as “Salsa Tekila” said the current price action reminds him of September 2020.

At the time, Bitcoin seemed to be breaking down, but a bullish engulfing daily candle caused a trend reversal, leading the BTC rally. He said:

“The $BTC price action observed yesterday reminds me of September 24, 2020. I was massively short that day, betting on a break-down. The sell-side got BTFO impulsively after dip buyers show up. Someone big had bought. I see similarities with the 30k vicinity. Could be wrong.”

In the foreseeable future, Bitcoin overtaking the $33,000 level is critical for a short-term resumption of the rally. Until BTC solidifies $33,000 as a support level once again, the trend remains neutral to bearish.

But one positive trend is that stablecoin deposits to exchanges are rising once again. This shows that sidelined capital is moving back into the Bitcoin market, which could result in a short-term catalyst for BTC.

The price of Bitcoin already rose from around $30,500 to over $31,500 as stablecoin deposits rose.

The post Why a trader says a Bitcoin bottom is close, based on a key technical structure appeared first on CryptoSlate.

Similar to Notcoin - Blum - Airdrops In 2024

origin »

Bitcoin (BTC) на Currencies.ru

$ 67906.37 (-0.16%)
Объем 24H $26.516b
Изменеия 24h: -0.92 %, 7d: -2.17 %
Cегодня L: $67343.07 - H: $68240.24
Капитализация $1338.218b Rank 1
Цена в час новости $ 32757.45 (107.3%)

close bottom trader bitcoin structure technical key

close bottom → Результатов: 102


Lisk Price Analysis LSK / USD: Shock Therapy

Lisk has a bearish short-term outlook, with the cryptocurrency suffering a severe double-digit intraday decline The four-hour time frame shows that a bearish head and shoulders pattern is close to reaching its downside target The daily time frame shows that the LSK / USD pair is approaching the bottom of a broadening wedge pattern Lisk […] The post Lisk Price Analysis LSK / USD: Shock Therapy appeared first on Crypto Briefing.

2019-8-15 16:45


Bitcoin [BTC]: Vinny Lingham claims BTC is in ‘recovery phase since the $3,100 bottom’

Bitcoin [BTC]’s recent rally had caused a lot of people involved in the cryptocurrency space to speculate that the bear market had come to a close and that a new bull run was on the horizon. This sentiment received a blow when on May 16, the world’s largest cryptocurrency dropped by 20 percent from its […] The post Bitcoin [BTC]: Vinny Lingham claims BTC is in ‘recovery phase since the $3,100 bottom’ appeared first on AMBCrypto.

2019-5-17 11:30


Фото:

Bitcoin Price Analysis: Upward Drift Continues Following Established Macro Support

Since mid-February, the bitcoin market has continued to drift upward toward a band of strong, macro resistance (shown below as a red band). This slow, drift upward marks our fourth test of the resistance zone and, unlike the three prior tests, our rejection of the level has shown a weakness on the side of the bears:Figure 1: BTC-USD, Daily Candles, Fourth RejectionIf we compare the three prior rejections (labeled 1, 2 and 3), we see that the move into this resistance level was violent — and had equally violent rejections.

2019-3-29 02:21


Фото:

Bitcoin Price Analysis: Bullish Rejection Wipes Out Bitcoin’s Weekend Gains

Over the weekend, a strong rally was stifled by an even stronger rejection as the bitcoin market was shoved into a band of overhanging resistance. This band of resistance has been mentioned several times in our analyses over the last few weeks as it has proven impossible to overcome for the time being:Figure 1: BTC-USD, Daily Candles, Failed BreakoutThis run to the low $4,000s coincided with a breakout of a rather large symmetrical triangle consolidation shown above.

2019-2-26 02:42


Фото:

Bitcoin Price Analysis: Bitcoin Tests Boundary Support as Demand Weakens

Following last Friday’s drop, bitcoin has found itself coiled, once again, at the bottom of the range it established back in December. With the current market unable to close a new high, the market finds itself in a precarious position:Figure 1: BTC-USD, Daily Candles, Range Support TestThe blue support level shown above illustrates the boundary of the multi-week range bitcoin has been bound by.

2019-1-18 02:02


Фото:

Bitcoin Price Analysis: Range-Bound Market Coiled for Next Move

For the better part of a month and a half, bitcoin has been fairly range-bound and unable to establish new lows or new highs. There are some bullish and bearish setups on the horizon for bitcoin, so let’s check out both sides of the argument because currently the market is sitting in the middle of Indecisionville — the most immediate sign of which is this glaringly obvious head-and-shoulders bottom reversal pattern:Figure 1: BTC-USD, Daily Candles, Head-and-Shoulders BottomThis current pattern is nothing more than a setup at the moment, but it represents one potential outcome of this sustained consolidation.

2019-1-4 02:22


Prominent Analyst: Crypto “Very Close” To Finding Bitcoin (BTC) Bottom

Crypto Analyst: Bitcoin Cash Hard Fork, Regulatory Qualms Have Been Bearish Catalysts  Naeem Alsam, a crypto-friendly contributor to Forbes and the Chief Market Analyst at ThinkMarkets, recently sat down with CoinTelegraph in the outlet’s “Time To Buy Bitcoin [BTC]?” exclusive to discuss his opinions on the market, and where BTC could potentially bottom.

2018-12-4 07:00