2024-1-4 09:52 |
These indicators are primarily mathematical calculations based on the price, volume, or open interest of a security or contract. By applying these tools, traders aim to eliminate the noise of random price fluctuations and focus on the underlying direction of the price trends.
Incorporating volume into technical analysis elevates the efficacy of these indicators. Volume, the total number of shares or contracts traded within a specified time frame, acts as the fuel behind the market movements. It provides a weight to the price action, offering insights into the strength or weakness of price trends. Acknowledging volume gives traders a comprehensive view, allowing them to make more informed decisions by confirming the robustness of price movements and potentially increasing the accuracy of their predictions. This integration of volume into technical analysis is crucial for a nuanced understanding of market dynamics.
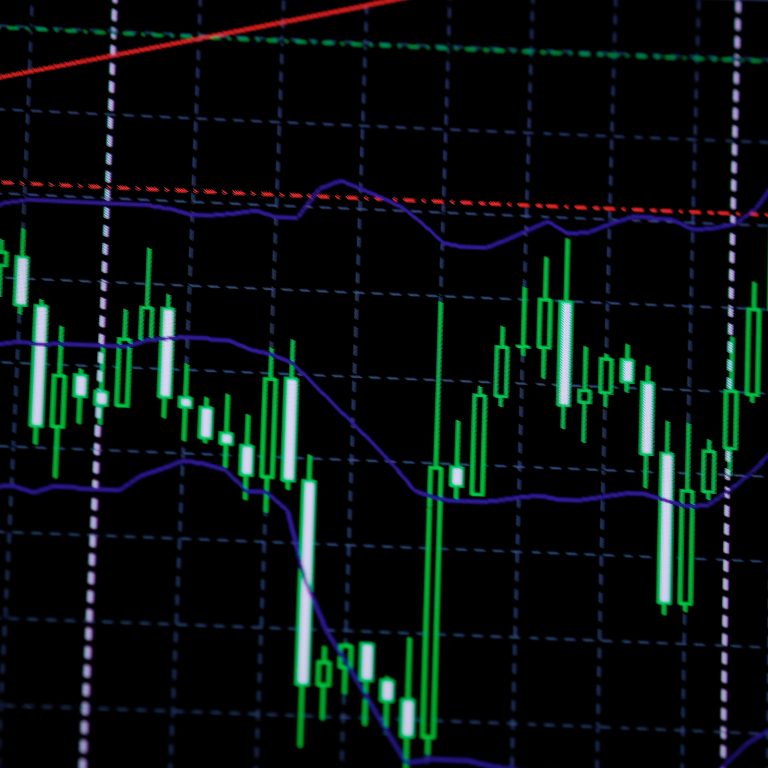
The Role of Volume in TradingVolume, in the context of financial markets, is the total quantity of shares or contracts traded in a given security or market during a specified time frame. It is a fundamental aspect of market data, representing the level of activity and liquidity in assets, which are critical for traders to understand market movement dynamics. The significance of volume lies in its ability to confirm trends and price patterns. A high volume indicates a high interest in the asset, often leading to more significant price movements and stronger trends.
For traders, especially those involved in day trading, identifying the best volume indicator for day trading is crucial. These indicators help in validating whether a price movement is supported by substantial trading activity. For instance, an upward price trend accompanied by increasing volume is typically viewed as a stronger, more reliable signal than the same movement on low volume. Conversely, if prices are moving but volume is declining, it may suggest a lack of conviction in the market trend, potentially signaling a reversal or slowdown. Thus, volume is a vital tool for traders in confirming trend strength and sustainability.
Common Volume-Based Technical IndicatorsSeveral technical indicators effectively incorporate volume, providing traders with insights into market strength and potential price movements. The Volume Oscillator is one such indicator, measuring the difference between two moving averages of volume. It helps identify trends in volume relative to price, indicating bullish or bearish movements based on volume surges or declines.
On-Balance Volume (OBV) is another critical volume-based indicator. It cumulatively adds or subtracts volume on days when the price goes up or down, respectively. The trend of the OBV is believed to precede price movements, offering a predictive signal. If the OBV is rising, it is typically seen as a signal that positive volume is driving prices up.
The Accumulation/Distribution Line is yet another vital indicator that combines price and volume to show how much of a stock is being accumulated or distributed. The indicator’s rise or fall reflects the consensus among investors: if it is rising, buying is dominant (accumulation), while falling suggests selling pressure (distribution).
Case Studies: Volume Indicators in ActionReal-life applications of volume indicators often underscore their value in trading strategies. For instance, a trader might observe an ascending OBV in tandem with price, interpreting it as a bullish sign and deciding to buy the asset. Conversely, if the OBV is diverging negatively from the price trend, it might signal an upcoming price drop, prompting a sell decision.
In another case, traders have used the Accumulation/Distribution Line to spot divergences from the price. For example, if a stock’s price is in an uptrend while the Accumulation/Distribution Line is trending downward, it might suggest that the stock is being distributed by large players, and a reversal might be imminent.
The Volume Oscillator, with its focus on volume momentum, is particularly effective in markets with large volume swings. Traders often look for significant peaks or troughs in the oscillator as signals for overbought or oversold conditions, respectively, aligning their trades accordingly.
These examples highlight how volume indicators not only aid in confirming trends but also in predicting potential reversals, playing a crucial role in formulating and adjusting trading strategies. Each indicator, with its unique approach to incorporating volume, offers different insights, contributing to a multifaceted understanding of market dynamics.
Integrating Volume Indicators into Trading StrategiesTraders can integrate volume indicators into their trading strategies to enhance decision-making and risk management. By overlaying volume indicators on price charts, traders can look for confirmation of breakouts or reversals. For instance, a price breakout with accompanying high volume may indicate a more reliable and sustainable move. Traders often combine volume indicators with other forms of analysis, such as trend lines and price patterns, to get a holistic view of the market. This multi-faceted approach helps in discerning stronger signals from noise, thereby improving the odds of successful trades. Consistency in using volume indicators alongside other techniques ensures a more robust and informed trading strategy.
Challenges and ConsiderationsOne common challenge in using volume-based technical indicators is the potential for over-reliance or misinterpretation of signals. Traders must understand that while volume indicators provide valuable insights, they are not infallible and should be used in conjunction with other analysis methods. Misreading volume signals or ignoring broader market contexts can lead to erroneous conclusions and trading decisions.
To overcome these challenges, traders should continuously educate themselves on various indicators and their appropriate applications. They should also backtest strategies using historical data to understand how volume indicators would have performed under different market conditions. Keeping abreast of market trends and remaining flexible in strategy adjustments are crucial. Traders should also be aware of the liquidity of the asset they are trading, as volume indicators might be less reliable in thinly traded or highly illiquid markets. By acknowledging these considerations and employing a disciplined approach, traders can effectively utilize volume indicators to enhance their trading strategies.
ConclusionThroughout this article, we’ve explored the significance of volume in trading, detailed popular volume-based technical indicators, and examined their practical applications through case studies. Incorporating volume indicators into trading strategies offers traders an added layer of insight, enhancing their ability to make informed decisions and potentially providing an edge in market analysis. As with any tool, understanding and proper application are key to leveraging the full benefits of volume indicators in trading.
origin »
Bitcoin price in Telegram @btc_price_every_hour
Open Trading Network (OTN) на Currencies.ru
|
|