2021-4-17 23:00 |
Bitcoin price is down from fresh all-time highs set this week ahead of the Coinbase Global Nasdaq public rollout, but there are still no signs of the bull run ending.
A powerfully bullish pattern, however, has began to shapeshift and is in the midst of transforming into a bearish pattern instead. The fight between bears and bulls clearly isn’t finished; here’s a closer look at the two patterns that could make or break the uptrend depending on which one confirms.
Bitcoin Price Breaks Down From Coinbase Listing HighsThe cryptocurrency market is a non-stop speculative venue where Bitcoin investors try to rely on a combination of sentiment, fundamental, and technical analysis to predict future outcomes of price action.
Users can be quick to write off such predictions claiming its little more than witchcraft or nonsense. There are several trading legends that have made a career out of it, but naysayers will always remain.
Related Reading | Coinbase COIN Debuts To A Bloody Bitcoin, But Bullish Structure Remains
The reason for such skepticism, is the fact that these predictions only work to increase probabilities, and the practice never a perfect process. It is also an ongoing study that requires regular review of market conditions and the latest usable data.
The data comes in the form of Japanese candlestick highs, lows, opens, and closes. It comes via moving averages, overlays, and oscillators. And it also comes from chart patterns that can change shape even when Bitcoin is at first behaving as expected.
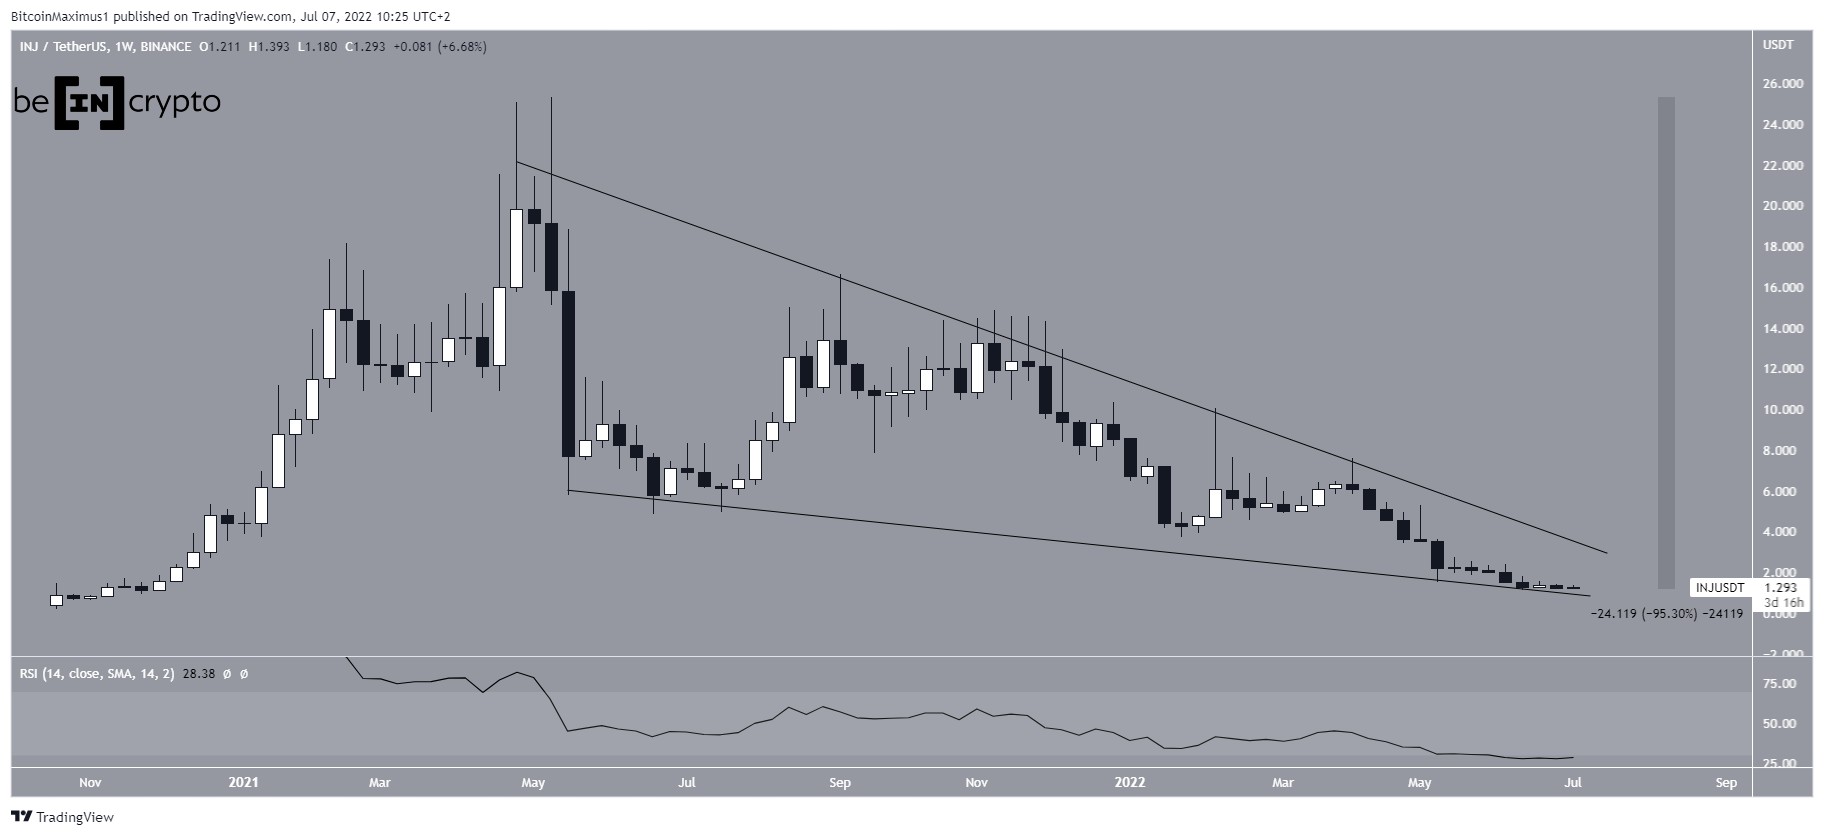
On the left, we have a bullish triangle and on the right, a bearish wedge | Source: BTCUSD on TradingView.com Bearish or Bullish: Which Crypto Chart Pattern Will Confirm?Even on Coinbase listing day itself, Bitcoin ended the day bloodier than it started. The leading cryptocurrency by market cap fell by a max of 5% for the day.
Any movement higher that might have been rejected, ultimately sent the crypto asset back down to retest the resistance level of a powerfully bullish chart pattern: the ascending triangle.
The problem is, is that the pattern has since morphed into a now bearish pattern and is looking worse as time passes by. Further exacerbating the danger, are literally dozens of bearish signals that have been lingering on the quarterly timeframe.
Technical Analysis Education | Everything You Need To Know About Triangles
Along with the bearish wedge shape, the MACD on weekly timeframes has crossed bearish, and a rare cycle top calling indicator has said its lights out for bulls soon enough.
Although the signal has appeared, Bitcoin is now much higher than when it first reared its ugly head. Bears were able to swat it back down, and what comes next will decide the fate of crypto for the next few months.
Will price action confirm resistance as support, and with it the ascending triangle before moving much higher? Or will the bearish wedge take shape further and cause an unexpected breakdown?
Featured image from Deposit Photos, Charts from TradingView.com origin »Bitcoin price in Telegram @btc_price_every_hour
Bitcoin (BTC) на Currencies.ru
|
|