TRX/USD bullish setup as it tries to overcome resistance

TRX/USD bullish setup as it tries to overcome resistance
фото показано с : coinjournal.net

2023-3-31 10:26

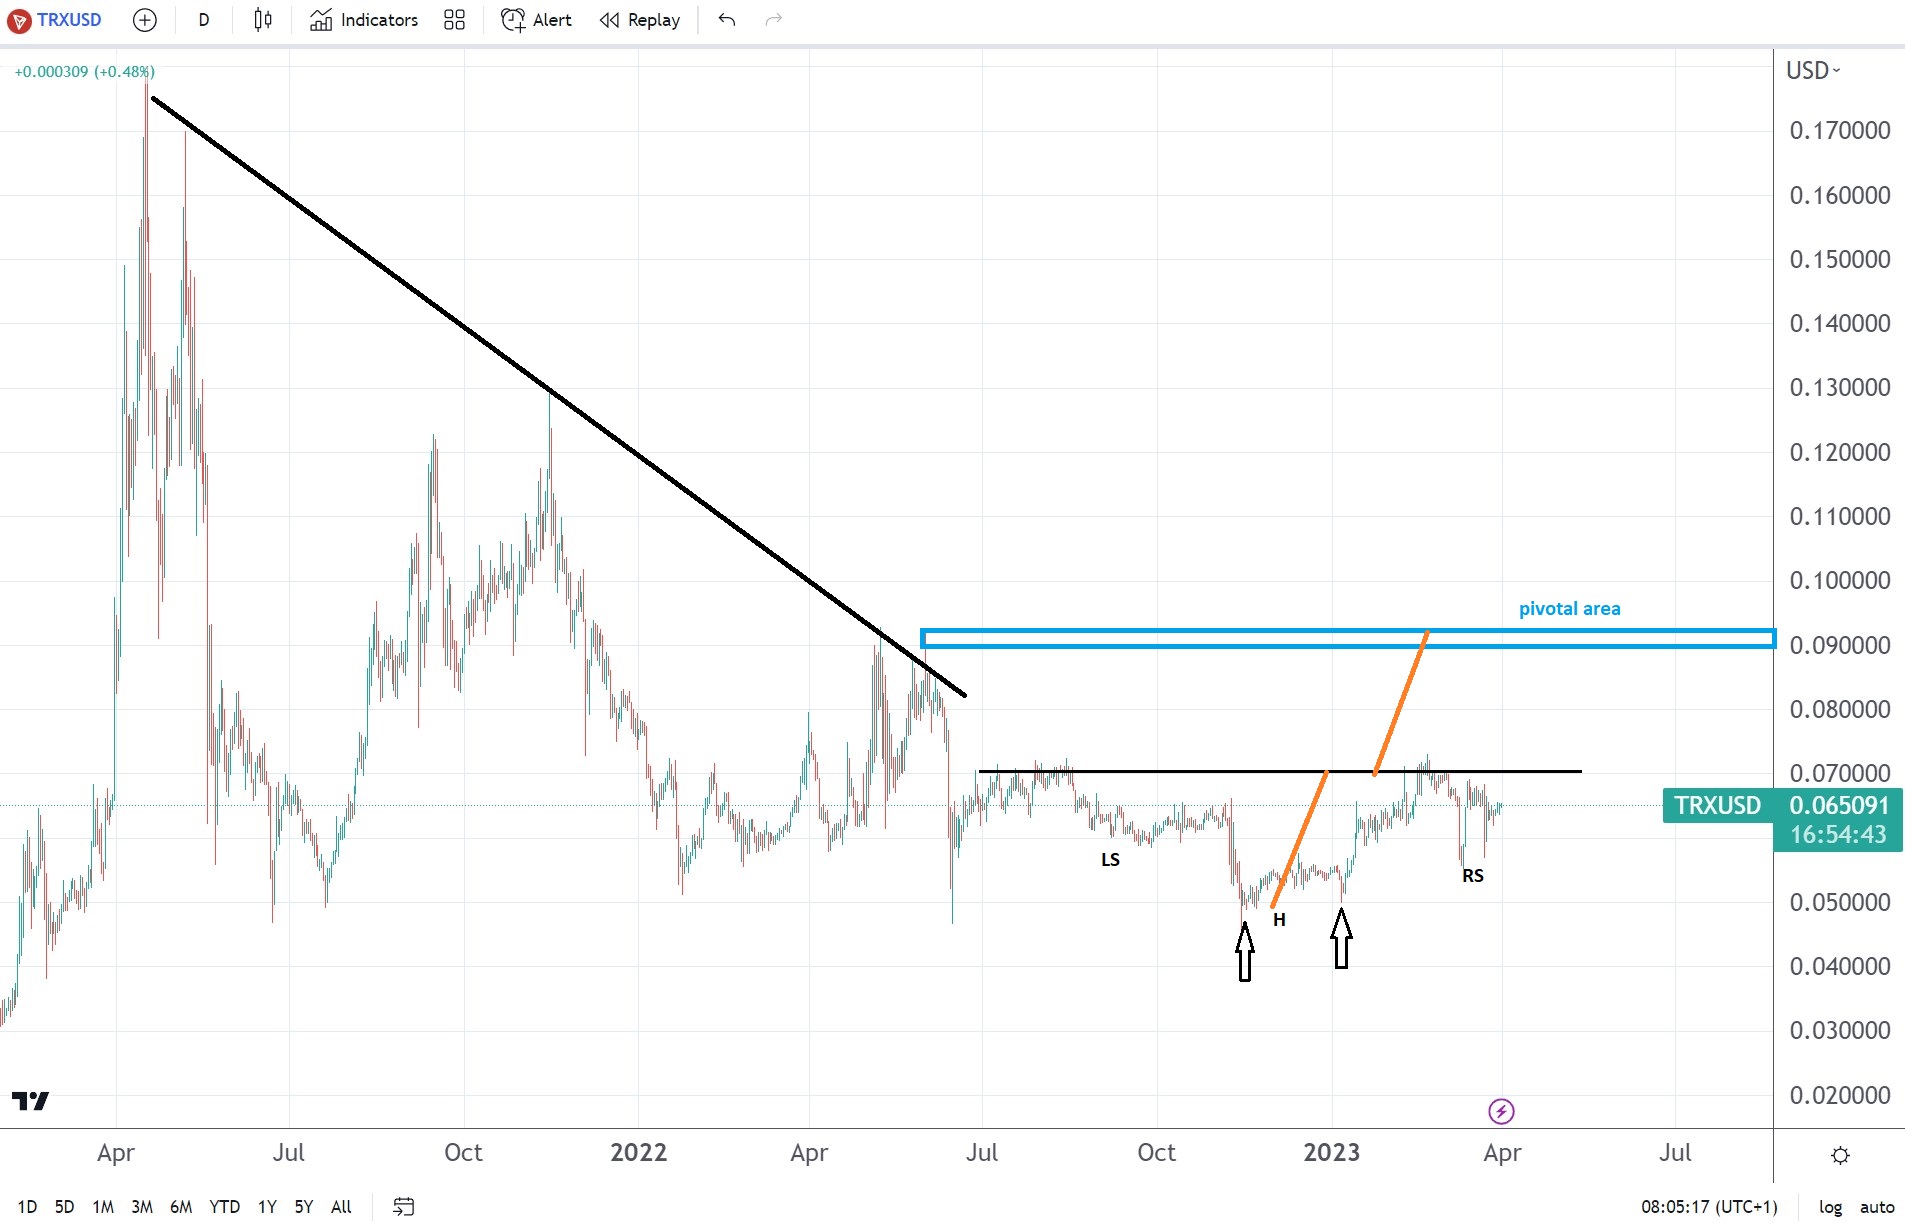
TRXUSD tries to overcome resistance seen at $0.07 A double bottom pattern formed at $0.05 An inverse head and shoulders pattern supports the bullish case

Another bullish setup appeared on the cryptocurrency market, this time involving TRON.TRX/USD struggles to overcome resistance seen at $0.07, and various bullish patterns formed in the meantime.

First, we should mention the bearish trend that lasted until the very last moment of 2022. Even in 2022, the market tried to make a new lower low, but somehow, bulls survived.

Second, even if the future price action confirms the double bottom and the inverse head and shoulders pattern, it would mean nothing if they are not accompanied by further strength above the previous higher low.

TRXUSD chart by TradingView

Tron has formed a double bottom pattern at $0.5

During the last weeks of 2022, Tron has formed a double bottom pattern. As it turned out, the $0.05 area was too difficult to break.

A double bottom is a reversal pattern – a bullish one. Hence, it forms at the end of bearish trends.

Its measured move coincides with the measured move of another bullish pattern – an inverse head and shoulders.

An inverse head and shoulders comes to support the bullish case

An inverse head and shoulders pattern takes more time to form. In this case, it took about half a year and is still incomplete. Bulls may want to see the price action closing above the neckline and then heading toward the measured move seen in orange on the chart above.

Whenever there are more than one patterns that point in the same direction, it is said that the market is in a confluence area. But the real bullish break, if any, would come only if TRX/USD is strong enough to break above $0.09, a pivotal area. On such a move, it means that the previous lower high is broken, and more strength should lie ahead.

The post TRX/USD bullish setup as it tries to overcome resistance appeared first on CoinJournal.

Similar to Notcoin - TapSwap on Solana Airdrops In 2024

origin »

Resistance (RES) на Currencies.ru

$ 0.0018624 (+0.63%)
Объем 24H $3.518k
Изменеия 24h: 0.10 %, 7d: 11.67 %
Cегодня L: $0.0018624 - H: $0.0018624
Капитализация $0 Rank 3118
Доступно / Всего 0 RES

bullish overcome resistance pattern tries setup another

bullish overcome → Результатов: 40


Will Bitcoin Price Finally Reach $10,000 This Week?

Bitcoin price saw a 3% move to $8,833 is bringing the digital asset closer to a retest of the weekly high. Will it happen before this new week starts?  Bitcoin Price Must Overcome This Key Hurdle for $10K Sentiment wise, bitcoin’s path to $10,000 remains strong and each week a number of positive media reports appear to be re-enforcing the bullish consensus for the top digital asset.

2019-6-3 07:00


Are Litecoin and Dash Setting up for Bullish Times Ahead? [Price Analysis]

Since forming 2018 lows in December, the price of cryptocurrency market leader Bitcoin has managed to recover near to a key level where price drastically broke down in November. If its price manages to overcome this point, it would be highly likely to have a significant impact on the altcoin market and may spur large amounts […] Are Litecoin and Dash Setting up for Bullish Times Ahead? [Price Analysis] was originally found on Cryptocurrency News | Tech, Privacy, Bitcoin & Blockchain | Blokt.

2019-5-7 17:49


Фото:

Bitcoin Price Analysis: Slow Upward Drift Tests Market Supply

A slow, grinding upward drift has been the name of the game for bitcoin’s market over the last few weeks. The upward drift is bringing us slowly to a level that was previously rejected violently:Figure 1: BTC-USD, Daily Candles, Upward DriftOur third rejection of the red resistance level shown above brought the market into a test of macro support in the mid-$3,000s.

2019-3-23 01:23


Фото:

Bitcoin Price Analysis: Bullish Rejection Wipes Out Bitcoin’s Weekend Gains

Over the weekend, a strong rally was stifled by an even stronger rejection as the bitcoin market was shoved into a band of overhanging resistance. This band of resistance has been mentioned several times in our analyses over the last few weeks as it has proven impossible to overcome for the time being:Figure 1: BTC-USD, Daily Candles, Failed BreakoutThis run to the low $4,000s coincided with a breakout of a rather large symmetrical triangle consolidation shown above.

2019-2-26 02:42


Фото:

Bitcoin Price Analysis: Consolidation Breaks Out Into Macro Resistance Test

Over the course of the last 10 days, bitcoin has managed to rally nearly 20% in value as it burst through two major resistance levels and is now beginning the test of a major macro level:Figure 1: BTC-USD, Daily Candles, Macro ResistanceWe can see a clear, descending supply-and-demand channel that governed the market for the last two months.

2019-2-20 01:38