2023-8-31 22:09 |
Leading crypto analyst Rekt Capital has highlighted an alarming technical pattern emerging in the Bitcoin charts. In a recent Twitter thread, he warns that Bitcoin may be tracing out a bearish fractal structure eerily similar to the one that preceded its crash from the 2021 bull market top.
This pattern, he notes, bears a striking resemblance to the price action.
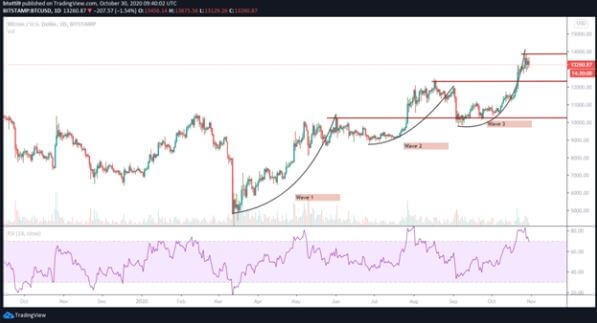
In 2021, Bitcoin exhibited a Double Top pattern, forming two clear tops before a third top emerged at a Lower High. Rekt Capital observes that Bitcoin appears to be tracing a similar path currently, with two clear tops already formed and a potential third top in the making at a Lower High.
What makes this potential third top particularly interesting is the presence of a diagonal Lower High resistance. This resistance has been holding the price back since it reached a local top of around $31,000. Currently, Bitcoin seems to be struggling to even approach these highs, let alone break through them. The reason for this struggle, according to Rekt Capital, lies in the Bull Market moving averages situated around the $27,000-$28,000 range. These averages, represented by the green 21-week EMA and the blue 50-week EMA, are acting as formidable resistance levels, much like they did in 2021.
In the previous year, Bitcoin managed to perform what Rekt Capital describes as a “fake-breakout” beyond these bullish moving averages. If history were to repeat itself, and Bitcoin were to break past these moving averages in the coming weeks, such a move could also turn out to be a fake-breakout. This could lead to the price eventually hitting the Lower High resistance and retracing.
The 2021 fractal suggests some cautionary notes for Bitcoin investors. According to this fractal, Bitcoin could soon form its third top at a Lower High, reject from there, and then lose the crucial support level of around $26,000. Following this, the cryptocurrency would likely bounce but only to turn the $26,000 level into new resistance before rejecting lower.
While Rekt Capital’s analysis provides a compelling narrative for what could unfold in the Bitcoin market, it’s crucial for investors to remember that fractal patterns are not a guarantee of future price action. They are one tool among many in the technical analyst’s toolkit, and it’s always advisable to conduct your own research and consider multiple factors before making any investment decisions.
Join us on Twitter and Facebook for the latest insights and discussions in the world of crypto.
Explore our news section and stay ahead of the curve with our expert price predictions.
The post Top Analyst Sees Troubling Similarities in Bitcoin – The 2021 Bull Trap Fractal Back in Play appeared first on CaptainAltcoin.
origin »Bitcoin price in Telegram @btc_price_every_hour
Bitcoin (BTC) на Currencies.ru
|
|