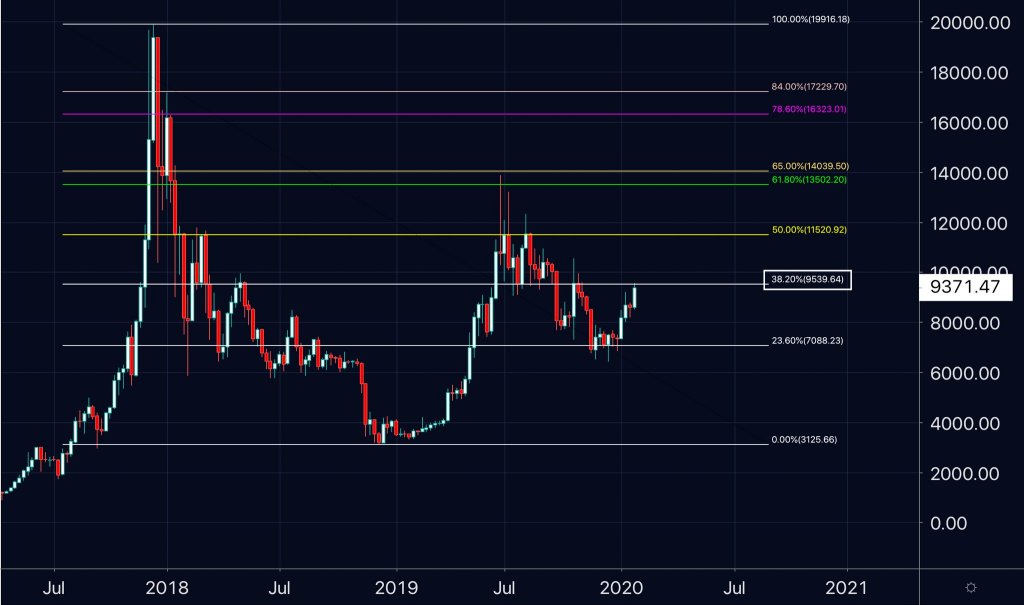
Inverse Chart Demonstrates Bitcoin Price Following Bear Bottom To Bull Market Fractal

2019-5-18 04:01

The leading cryptocurrency by market cap has only been around for just over a decade. Due to this, there isn’t much history in Bitcoin price charts to attempt to discover historical repeating patterns that can be used to help determine future movements.

The best example of a previous bear into bull market cycle playing out,. . .

The post Inverse Chart Demonstrates Bitcoin Price Following Bear Bottom To Bull Market Fractal appeared first on NewsBTC.

.

Similar to Notcoin - TapSwap on Solana Airdrops In 2024

origin »

Bitcoin (BTC) на Currencies.ru

$ 66989.25 (+0.18%)
Объем 24H $17.145b
Изменеия 24h: 0.18 %, 7d: 10.03 %
Cегодня L: $66739 - H: $67313.92
Капитализация $1319.852b Rank 1
Цена в час новости $ 7991.56 (738.25%)

market bear bitcoin price inverse fractal bottom

market bear → Результатов: 126


Фото:

DappRadar: Interest in Blockchain games continues despite the bear market

The decentralized applications (dApps) industry has, like the rest of the crypto space, been hit by the impact of a prolonged bear market. As the crypto market’s total valuation fell from highs of $3 trillin in 2021 to below $1 trillion – a multi-year low going back to 2020 – the same scenario unfolded in […] The post DappRadar: Interest in Blockchain games continues despite the bear market appeared first on Invezz.

2022-6-22 19:15