2021-7-1 21:30 |
Similarly to May, the month of June has been bearish for the cryptocurrency market. While Bitcoin (BTC) stemmed its fall, decreasing by only 7%, numerous altcoins have resumed the decrease from the previous month.
The ten altcoins that increased the most in June are:
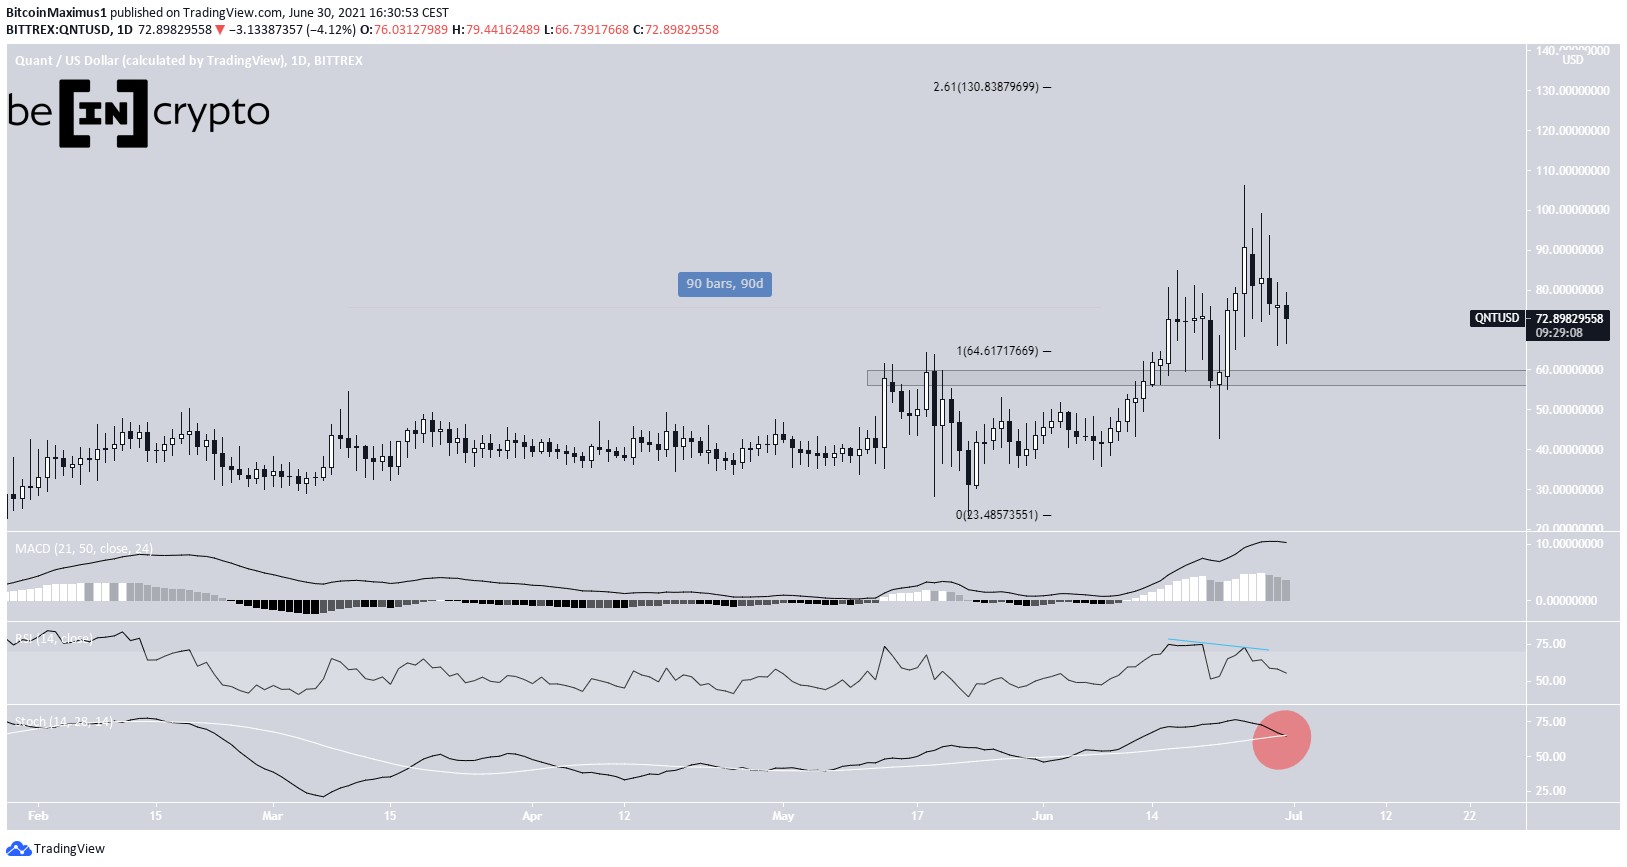
QNT : 67% AMP : 50% PHA : 26% WAVES : 22% CREAM : 20% TFUEL : 17% KAVA : 14% SYLO : 11% TOMO : 10% HARD : 9% Quant (QNT)QNT was subject to very interesting movement in the month of June. The token had been consolidating inside the $40-$55 area for roughly 90 days, beginning in March. Afterwards, it managed to break out on June 15 before validating the breakout level of $58 as support on June 22. This led to an all-time high price of $106 being reached on June 25.
However, QNT has been falling since. In addition, technical indicators are showing weakness, visible by the bearish divergence in the RSI and bearish cross in the Stochastic oscillator (red circle).
The closest support area is at $58, while the next resistance is at $130. It is created by the 2.61 external Fib retracement level.
Chart By TradingView Amp (AMP)Similarly to QNT, AMP also broke out and managed to reach a new all-time high in June. It did so on June 16, with a high of $0.121.
The high was reached very close to the 1.61 external Fib retracement level at $11.
AMP has been falling since reaching the aforementioned high. It has broken down below the $0.077 area, which was expected to act as support.
It is now approaching the $0.04 horizontal support area and has reached an ascending support line.
However, technical indicators are bearish, supporting the possibility that AMP will break down. If so, it would be expected to reach the $0.04 area once more.
Phala Network (PHA)PHA has been decreasing alongside a descending resistance line since May 15.
Throughout the decrease, it bounced at the $0.58 support area twice, on May 24 and June 22. This seemed to create a double bottom pattern.
On June 22, the token began an upward movement and broke out from a descending resistance line on June 30.
The next closest resistance area is at $1.03, the 0.618 Fib retracement resistance level.
Technical indicators are providing some bullish signs, such as the bullish reversal signal in the MACD and RSI cross above 50. However, the bullish reversal is not confirmed yet.
Chart By TradingView Waves (WAVES)WAVES has been following an ascending support line since the beginning of the year. On May 4, the token reached an all-time high price of $41.8 before falling sharply. It returned to the support line once more on May 23 and has been hovering just above it since.
While it initially broke down on June 22, this turned out to be a deviation only (red circle).
Technical indicators are providing some bullish signs. Both the RSI & MACD have generated bullish divergence. The former is close to moving above 50 while the latter is nearly positive.
The closest resistance area is at $23.20, the 0.382 Fib retracement resistance level.
Chart By TradingView Cream Finance (CREAM)Since Feb. 24, CREAM has been trading inside a range between $100 and $180. So far, it has touched both the resistance and support areas numerous times.
Most recently, it was rejected by the $180 resistance area on June 9 and is now back in the middle of the range.
Technical indicators are providing a fairly neutral view.
Until the token breaks out or down from this range, the direction of the trend cannot be determined.
Chart By TradingView Theta Fuel (TFUEL)On June 1, TFUEL broke out from a descending channel that had been in place since March 24. It proceeded to reach an all-time high price of $0.679, doing so on June 9. The high was made at the $0.69 target by using a Fib projection on waves 1-3 (white).
TFUEL has been moving downwards since. Currently, it is in the process of breaking down from the $0.41 horizontal support area, a movement which could trigger a sharp fall.
In addition to this, technical indicators are bearish. The MACD is negative, the RSI has fallen below 50 and the Stochastic oscillator has made a bearish cross.
Therefore, it is likely that the token breaks down and resumes its descent.
Chart By TradingView Kava.io (KAVA)KAVA has been trading inside a descending parallel channel since April 6, in what is likely a corrective decrease
Until now, it has unsuccessfully attempted to break out thrice (red icons). Currently, it is in the process of making its fourth attempt at breaking out.
In addition to this, technical indicators are showing numerous bullish signs. The Stochastic oscillator has made a bullish cross and the RSI has already moved above 50.
Therefore, a breakout could occur. If so, the next resistance would be at $7.25.
Chart By TradingView Sylo (SYLO)SYLO has been moving upwards since June 22, when it reached a low of $0.0038. The low was made right at the 0.786 Fib retracement support level.
The upward movement is supported by readings from technical indicators. The RSI has crossed above 50, the MACD is nearly positive and the Stochastic oscillator has made a bullish cross.
The closest resistance levels are between $0.0094-$0.0107, the 0.5-0.618 Fib retracement resistance area.
Chart By TradingView Tomochain (TOMO)TOMO has been following a descending resistance line since April 10, when it reached a high of $3.67.
The token bounced at May 19, initiating the current upward movement. However, it has failed to break out from the aforementioned descending resistance line. In addition, it faces resistance from the 0.382 Fib retracement level at $1.96.
Technical indicators provide a relatively neutral outlook.
Therefore, until a breakout from this line/area occurs, the trend cannot be considered bullish.
Chart By TradingView Hard Protocol (HARD)On May 23, HARD bounced at a long-term ascending support line. While the upward movement was significant, it failed to cause a reclaim of the $1.25 horizontal resistance area.
To the contrary, HARD was rejected, creating two long upper wicks (red icons).
Until the area is reclaimed, the trend cannot be considered bullish.
Chart By TradingViewFor the top-10 altcoins in May, click here.
The post Top 10 Altcoin Performer Showcase For June 2021 appeared first on BeInCrypto.
origin »Bitcoin price in Telegram @btc_price_every_hour
Bitcoin (BTC) на Currencies.ru
|
|