2021-6-1 12:44 |
The aim of both XRP (XRP) & Stellar (XLM) is to move money around at low costs and high speeds. While the former focuses more on the banking sector, the latter focuses on sections of the world without financial institutions.
In this article, BeInCrypto will take a look at the movement of both in order to determine which has a higher potential for increases in the month of June.
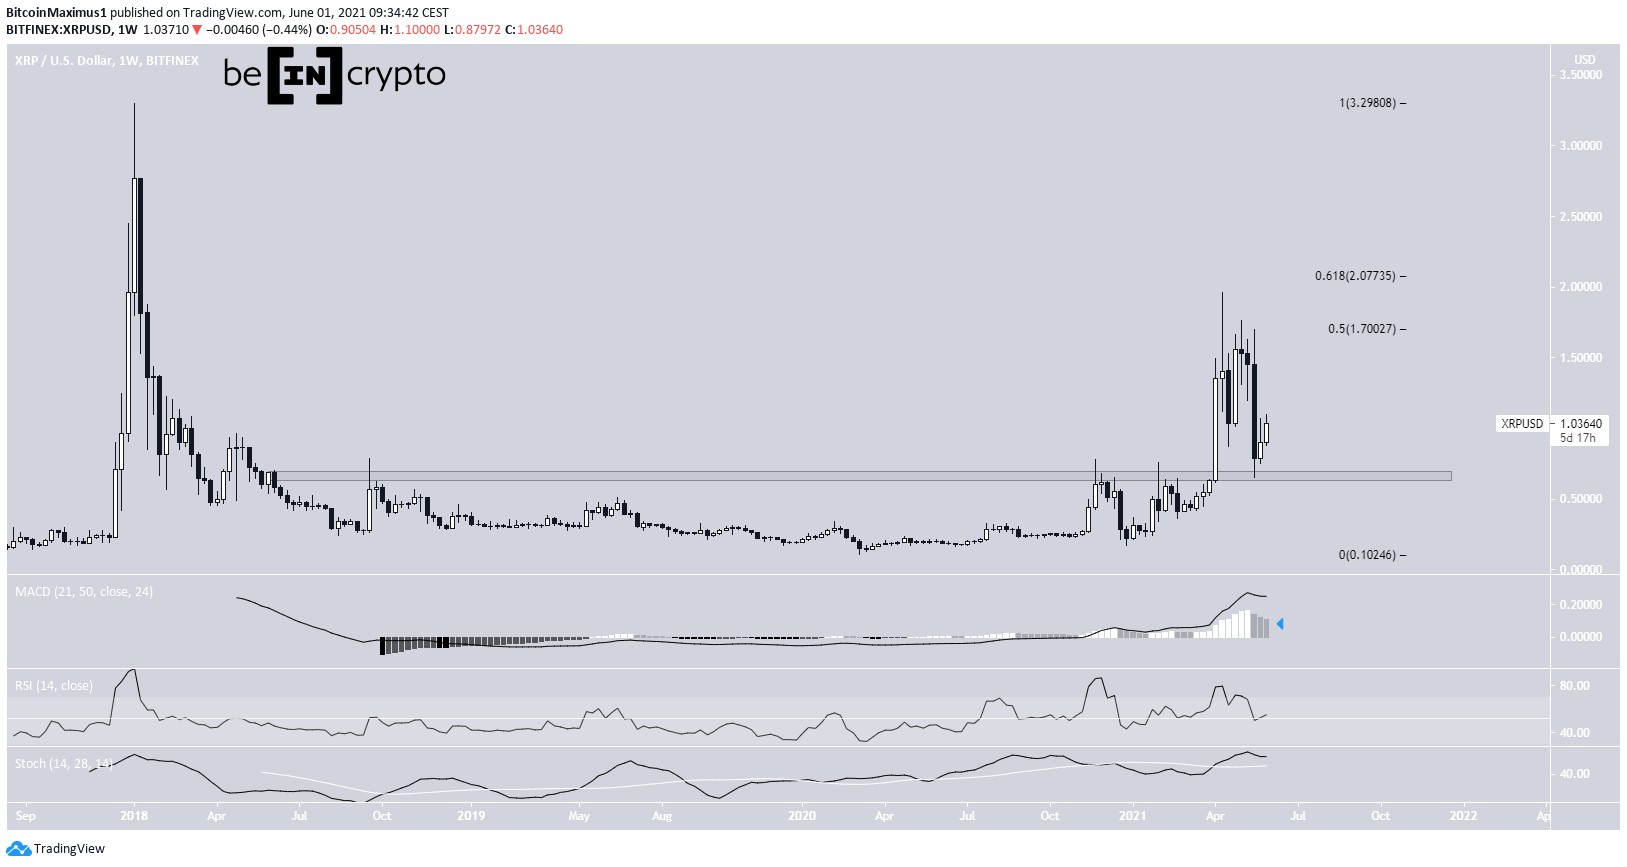
XRPXRP decreased considerably in the latter part of May, falling below the $1 threshold. However, it bounced at the $0.66 area, validating it as support.
Prior to breaking out in March, XRP had been trading below this level since April 2018. Therefore, it accumulated for roughly three years before breaking out and has now returned to validate the area as support.
Technical indicators still provide a bullish outlook. The Stochastic oscillator is increasing and the RSI is above 50. While the MACD has generated several lower momentum bars, it has not given a bearish reversal signal due to the lack of a bearish close.
Therefore, weekly readings are still bullish. The next closest resistance levels are at $1.70 and $2.07.
XRP Chart By TradingView
The daily chart shows a descending parallel channel in place since April 14. Such channels often contain corrective movements.
While inside the channel, XRP broke down below the $0.90 support area. However, it bounced at the support line on May 23 (red circle) and has been increasing since. This renders the previous breakout a deviation, which is likely to lead to a sustained movement in the other direction.
Technical indicators are relatively bullish. The MACD has given a bullish reversal signal and the RSI is increasing even though it’s below 50. However, the Stochastic oscillator is still bearish.
The main resistance area is found at $1.46, which is the resistance line of the channel. If it manages to move above, XRP is expected to increase towards the previously outlined resistances of $1.70 and $2.07.
XRP Chart By TradingView
The XRP/BTC chart also looks bullish. It shows a breakout from a descending resistance line that has been in place since August 2018. This is similar to the USD pair breakout above the $0.66 area.
In addition, technical indicators are bullish. The MACD is increasing, nearly crossing above the 0-line, the Stochastic oscillator is increasing after making a bullish cross, and the RSI is above 50 and has generated a hidden bullish divergence.
There is strong resistance at 4,200 satoshis. If a breakout occurs, XRP could increase at an accelerated rate.
XRP/BTC Chart By TradingView
XLMThe weekly chart shows that XLM decreased considerably in the second half of May, falling all the way to a low of $0.256.
However, it reclaimed the $0.325 area shortly after, validating it as support once more.
Despite the bounce, technical indicators are bearish. The RSI has fallen below 50 and the Stochastic oscillator has made a bearish cross (red icon). In addition, the MACD is decreasing.
XLM Chart By TradingView
The daily chart fails to confirm the direction of the trend since technical indicators are bearish/neutral.
While there is no discernible pattern in place, it’s possible that XLM is trading inside a descending wedge. At the current time, the price is right at the support line of the pattern, which also coincides with the previously outlined support area at $0.325.
However, the pattern is not yet confirmed, since only the support line has been validated sufficient times.
XLM Chart By TradingView
The XLM/BTC chart is more bullish. After accumulating for 300 days, it broke out from the 1,050 satoshi area.
The dip that followed caused it to return to validate the level as support. Furthermore, technical indicators are bullish, since the MACD, RSI, and Stochastic oscillator are all positive. However, they are showing a lack of momentum.
Nevertheless, the trend can be considered bullish as long as XLM is trading above 1,050 satoshis. The next resistance is found at 2,000 satoshis.
XLM/BTC Chart By TradingView
For BeInCrypto’s latest bitcoin (BTC) analysis, click here.
The post XRP vs XLM — Which Will Perform Better In June? appeared first on BeInCrypto.
origin »Bitcoin price in Telegram @btc_price_every_hour
Ripple (XRP) на Currencies.ru
|
|