2020-9-15 18:15 |
The Theta Token (THETA) price is in the process of making its third attempt at reaching a new all-time high.
The short-term signals on the other hand indicate that a rejection followed by a dip towards support is more likely to transpire than a successful breakout.
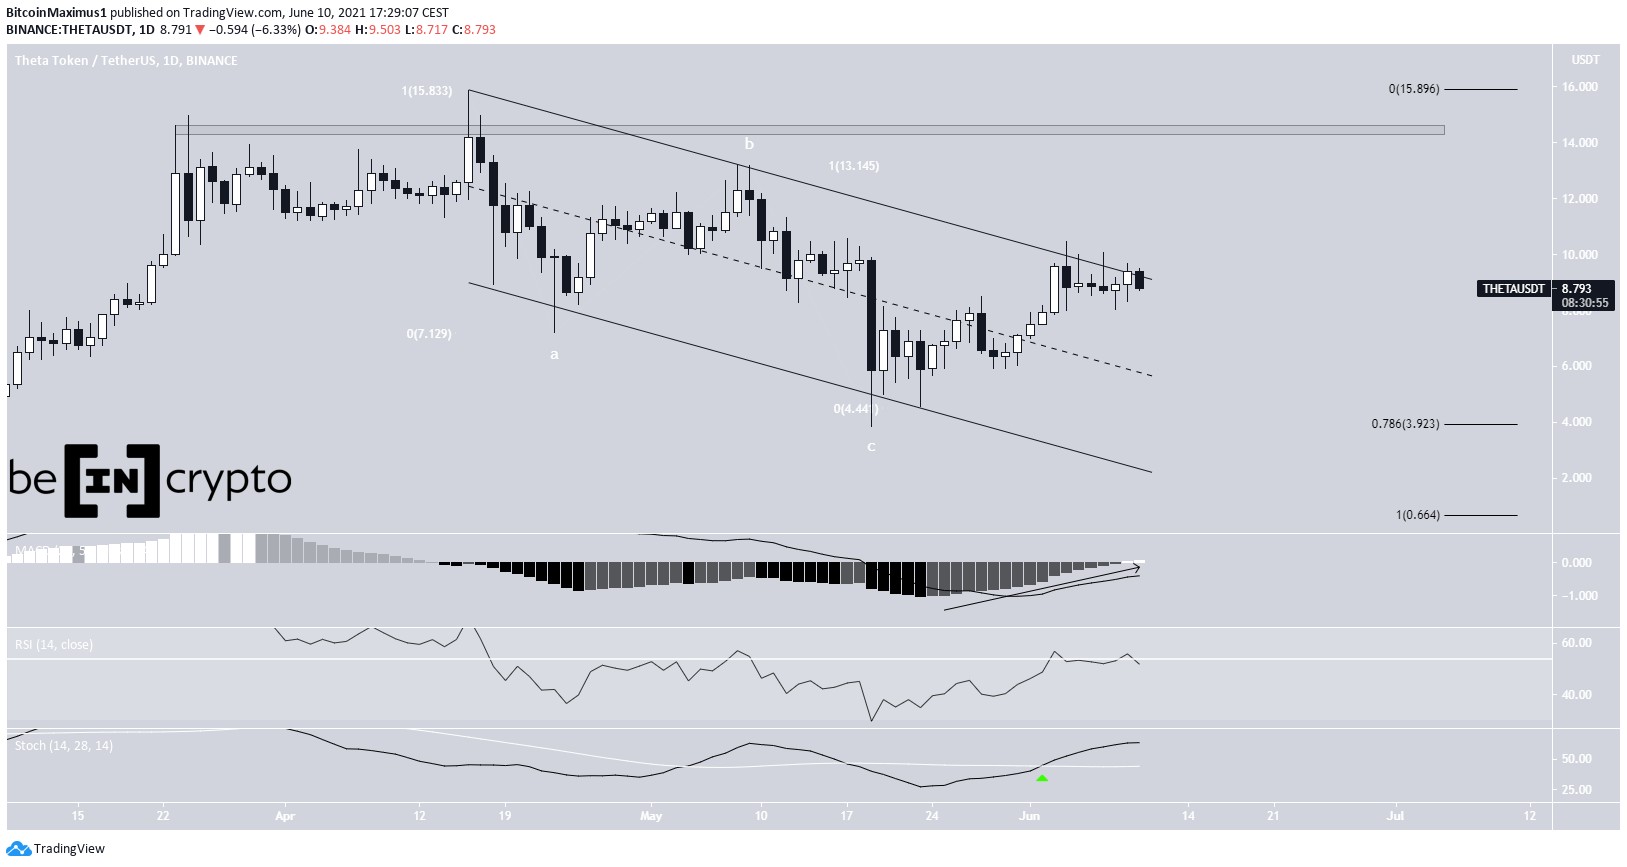
THETA Makes Another Attempt at All-Time HighOn May 27, the THETA price reached a high of $0.589. A sharp decrease followed that took the price towards the $0.20-$0.25 area, initiating a period of consolidation that continued until July 31.
Afterward, the price increased alongside an ascending support line and made another attempt at breaking out above the $0.58 area, which was also unsuccessful. At the time of press, THETA was in the process of making yet another breakout attempt.
The movement pattern is conflicting:
The bearish bias suggests that the price broke down from the ascending support line and is currently in the process of validating the line as resistance. The bullish bias suggests that the price is currently at the breakout level of a cup and handle pattern, which could take THETA to a new all-time high. In this case, the handle portion of the pattern is completed inside the minor support area of $0.40. THETA Chart By TradingViewCryptocurrency trader @mesawine1 stated that THETA could move up in a similar fashion to OMG. Mesa also highlighted the possible cup and handle pattern.
This is just one of the possibilities, but the fact that the price broke down from the support line and is trading inside resistance casts some doubt on the possibility of a breakout.
Source: Twitter Technical IndicatorsTechnical indicators also give conflicting conclusions.
The MACD is increasing and has crossed into positive territory. While the stochastic RSI has made a bearish cross, its slope has been increasing and could eventually make a bullish cross.
However, there is a significant bearish divergence in the RSI which suggests that a decrease towards the $0.40 support area is more likely.
THETA Chart By TradingViewFinally, the shorter-term two-hour chart contains no ambiguity, since all the readings are bearish. There is a triple bearish divergence, visible in the MACD, RSI, and Stochastic RSI. The latter has already made a bearish cross.
This indicates that a drop toward the support level is likely. The first minor support area would be found at $0.445. If the price manages to bounce at this level, it would increase the possibility of continuation and a new breakout attempt with the creation of a higher-low.
If however, the price falls towards $0.40, the movement would be considered bearish, increasing the possibility of a breakdown.
THETA Chart By TradingViewTo conclude, the price is expected to decrease towards $0.445 and possibly $0.40. If it manages to create a higher low at $0.445, the possibility of upwards continuation would be much higher than if it falls to $0.40.
The post THETA Wrestles to Break Above All-Time High Levels appeared first on BeInCrypto.
origin »Bitcoin price in Telegram @btc_price_every_hour
Theta Token (THETA) на Currencies.ru
|
|