2021-1-21 23:02 |
The Theta Token (THETA) price has been declining after reaching an all-time high price on Jan. 2.
Despite the drop, THETA’s short-term move still looks bullish, allowing for the possibility of another retest of the highs and possibly a breakout.
Long-Term Upward MoveWhile THETA declined in the latter part of 2019, it has been moving upwards at an accelerated rate since dropping in March 2020, which took it to a low of $0.035.
The increase accelerated on Dec. 2020, and THETA reached a new all-time high price of $2.51 on Jan. 2, 2021.
Despite the nearly parabolic rate of increase and the lack of support below the current price, technical indicators are still bullish. They have failed to form any significant weakness.
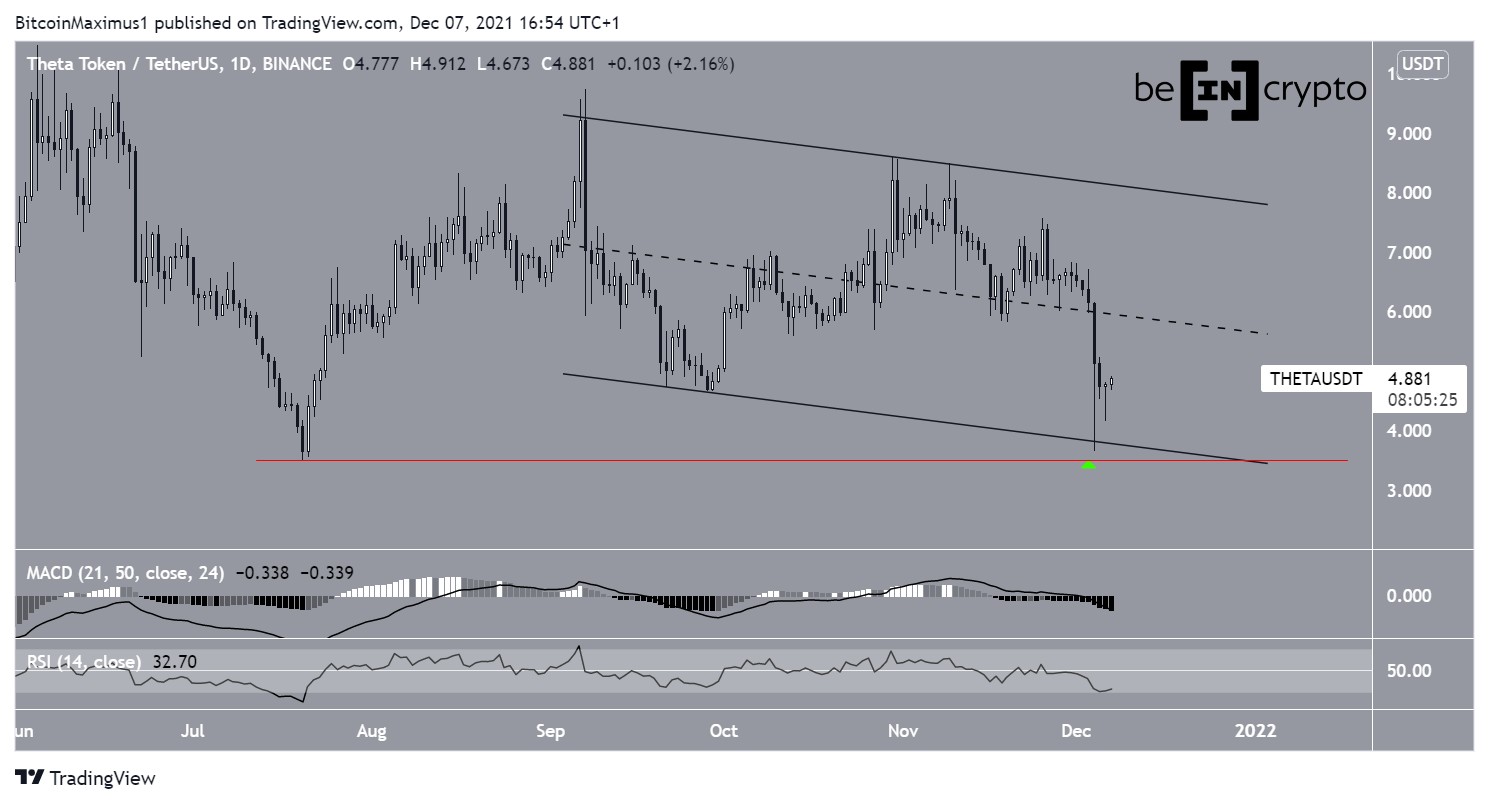
Chart By TradingViewThe daily chart similarly fails to provide a clear direction for the next move. While THETA has been declining since the all-time high on Jan. 2, it created a very long lower wick on Jan. 11, a strong sign of buying pressure.
On the flip side, technical indicators fail to provide confluence as to the direction of the trend.
Both the MACD and the Stochastic Oscillator are clearly bearish since the latter has made a bearish cross, and the former has nearly crossed into negative territory. However, the RSI is above 50 and has generated significant hidden bullish divergence, a strong sign of trend continuation.
Therefore, a look at lower time-frames is needed to determine where THETA is heading next.
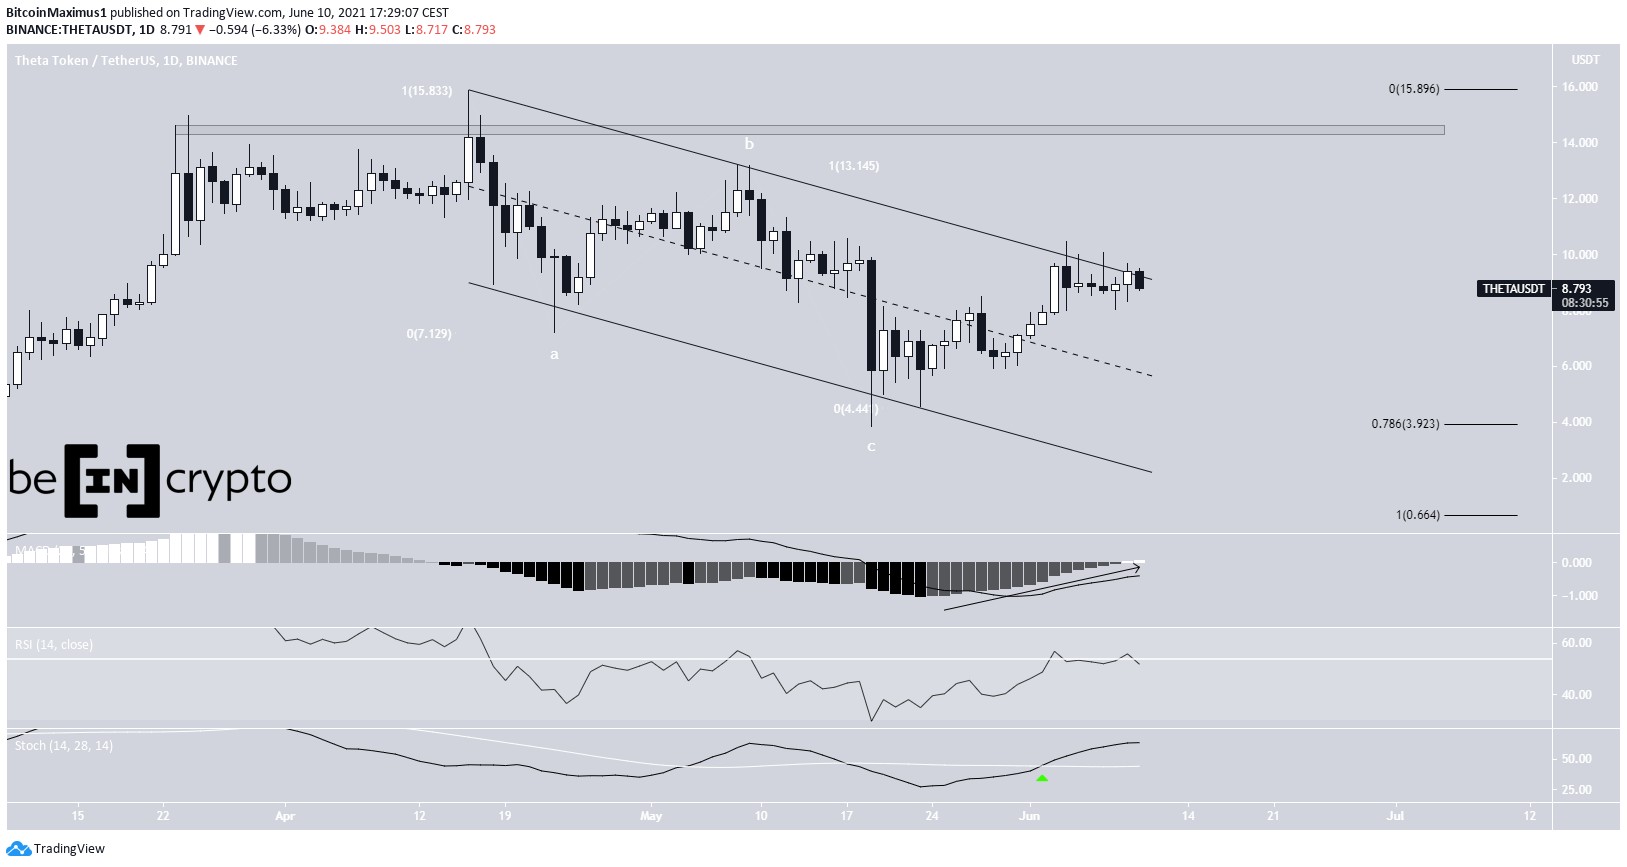
Chart By TradingView THETA’s Short-Term MovementCryptocurrency trader @PostyXBT outlined a THETA chart that shows a breakout from a short-term parallel descending channel.
Source: TwitterThe shorter-term six-hour chart shows that THETA has broken out from a descending resistance line and validated it as support afterward (shown with the green arrow).
While THETA has been falling since the bounce, following another descending resistance line (dashed), it is trading just above the 0.5 Fib retracement level, which is likely to provide support.
Therefore, as long as THETA trades above the $1.77-$1.86 area, which is the 0.5-0.618 Fib retracement level of the entire upward move, it’s likely to continue rallying.
A breakout from the dashed descending resistance line would confirm that THETA is making another attempt to reach all-time highs. However, there are no short-term signs of a reversal yet.
Chart By TradingView ConclusionTo conclude, the long-term trend for THETA still appears bullish, and a short-term bounce that retests the all-time highs is expected as long as THETA does not break down below the $1.77-$1.86 support area.
For BeInCrypto’s latest Bitcoin (BTC) analysis, click here!
The post THETA Drops After Reaching New All-Time High appeared first on BeInCrypto.
origin »Bitcoin price in Telegram @btc_price_every_hour
Theta Token (THETA) на Currencies.ru
|
|