2020-11-27 06:48 |
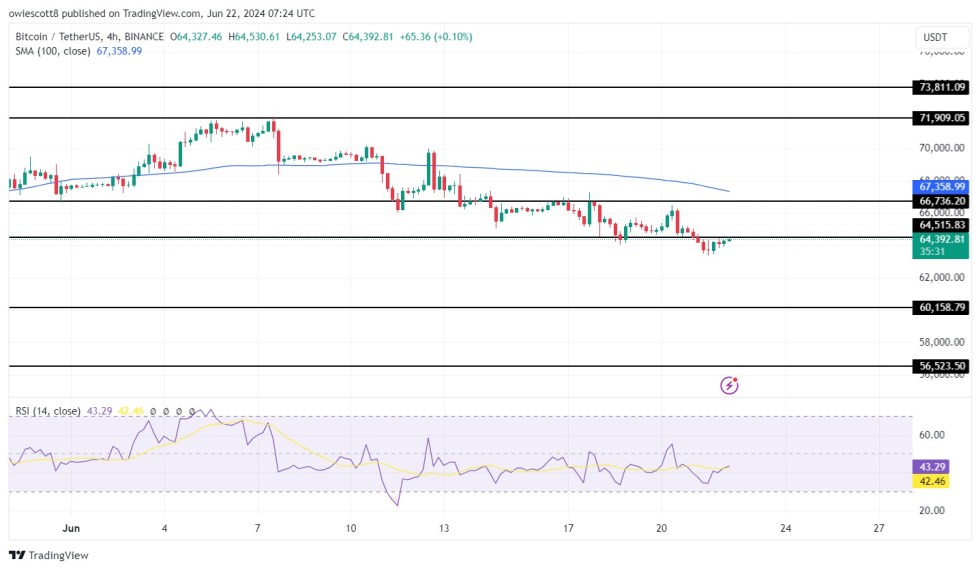
Bitcoin price declined heavily, but it found support near $16,300 against the US Dollar. BTC is likely forming a double bottom pattern and it could rally if it clears $17,500.
Bitcoin is holding the $16,300 support zone and trading above $17,000. The price is facing a strong resistance near $17,500 and it is well below the 100 hourly simple moving average. There is a key bearish trend line forming with resistance near $17,500 on the hourly chart of the BTC/USD pair (data feed from Kraken). A possible double bottom pattern is emerging with support near $16,300. Bitcoin Price Likely To Rally AgainThere was sharp decline in bitcoin price below the $18,000 and $17,200 levels. BTC even spiked below $16,500 before the bulls protected the $16,300 support zone.
There were two attempts by the bears to push the price below $16,300 and $16,200, but they failed. A swing low is formed near $16,219 and the price is currently rising. It is trading above the 23.6% Fib retracement level of the recent decline from the $19,500 swing high to $16,219 low.
It seems like there is a possible double bottom pattern emerging with support near $16,300. The breakout resistance is forming near the $17,500 level.
Source: BTCUSD on TradingView.comThere is also a key bearish trend line forming with resistance near $17,500 on the hourly chart of the BTC/USD pair. The next major resistance is near the $17,850 or the 50% Fib retracement level of the recent decline from the $19,500 swing high to $16,219 low.
Bitcoin price is likely to start a strong increase if it clears the breakout resistance at $17,500 and then gains pace above $17,850. The next major resistance sits near the $18,400 level or the 100 hourly simple moving average.
Failure in BTC?If bitcoin fails to clear the breakout resistance at $17,500, there is a risk of a fresh decline. An initial support on the downside is near the $16,800 level.
The first major support is near the $16,500 level. The main support is near the double bottom zone at $16,300. A daily close below the $16,300 and $16,200 levels could open the doors for another slide.
Technical indicators:
Hourly MACD – The MACD is now gaining momentum in the bullish zone.
Hourly RSI (Relative Strength Index) – The RSI for BTC/USD is currently recovering and approaching the 50 level.
Major Support Levels – $16,800, followed by $16,300.
Major Resistance Levels – $17,500, $17,850 and $18,400.
origin »Bitcoin price in Telegram @btc_price_every_hour
Bitcoin (BTC) на Currencies.ru
|
|