2021-9-8 06:08 |
Bitcoin price declined over 15% and tested $42,000 against the US Dollar. BTC is recovering, but it could face sellers near the $48,500 and $49,000 resistance levels.
Bitcoin started a major decline below the $50,000 and $48,500 support levels. The price is now trading well below $50,000 and the 100 hourly simple moving average. There was a break below a key bullish trend line with support near $52,150 on the hourly chart of the BTC/USD pair (data feed from Kraken). The pair is correcting losses, but the bears are likely to remain active near $48,500 and $50,000. Bitcoin Price Recovers Above $45KBitcoin price failed to clear the $53,000 zone and started a major decline. BTC broke the key $52,000 support zone and the 100 hourly simple moving average to into a bearish zone.
There was also a break below a key bullish trend line with support near $52,150 on the hourly chart of the BTC/USD pair. The pair even declined heavily below the $48,500 support zone. Finally, there was a spike below the $45,000 support zone and the price tested the $42,000 level.
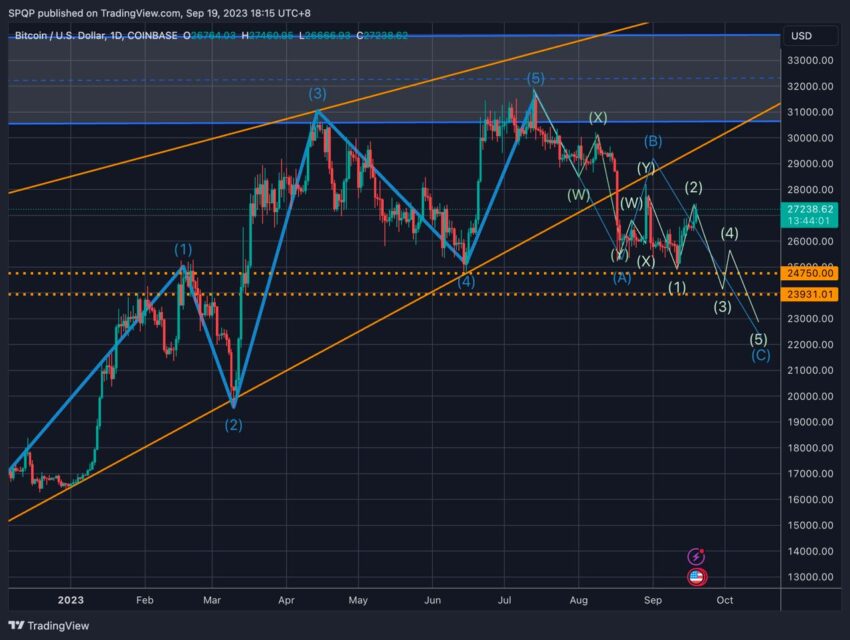
A low was formed near $42,000 before there was a recovery wave. The price climbed above the $45,000 resistance. It broke the 23.6% Fib retracement level of the recent decline from the $52,800 swing high to $42,000 swing low.
Source: BTCUSD on TradingView.comAn immediate resistance on the upside is near the $47,500 level. It is near the 50% Fib retracement level of the recent decline from the $52,800 swing high to $42,000 swing low. The first major resistance is near the $48,500 level. A close above the $48,500 level could pump the price in the near term. The next major hurdle for the bulls could be near the $50,000 zone.
More Losses In BTC?If bitcoin fails to clear the $48,500 resistance zone, it could start a fresh decline. An immediate support on the downside is near the $46,500 level.
The first major support is near the $46,000 level. If there is a downside break below the $46,000 support zone, the price could extend its decline. In the stated case, the price could test the $43,500 support.
Technical indicators:
Hourly MACD – The MACD is slowly gaining pace in the bullish zone.
Hourly RSI (Relative Strength Index) – The RSI for BTC/USD is still well below the 50 level.
Major Support Levels – $46,500, followed by $46,000.
Major Resistance Levels – $47,500, $48,500 and $50,000.
origin »Bitcoin price in Telegram @btc_price_every_hour
Bitcoin (BTC) на Currencies.ru
|
|