2024-4-23 06:07 |
Bitcoin price extended its increase and climbed above the $66,000 resistance zone. BTC is now showing positive signs and might find bids near $65,500.
Bitcoin gained pace for a move above the $65,500 resistance zone. The price is trading above $65,500 and the 100 hourly Simple moving average. There is a key bullish trend line forming with support at $65,700 on the hourly chart of the BTC/USD pair (data feed from Kraken). The pair could correct lower, but the bulls might remain active near the $65,500 support. Bitcoin Price Gains StrengthBitcoin price started a fresh increase above the $64,500 and $65,000 resistance levels. BTC bulls even pushed the price above the $66,000 resistance. It traded to a new weekly high at $67,200 and is currently consolidating gains.
The price is slowly moving lower toward the 23.6% Fib retracement level of the upward move from the $64,281 swing low to the $67,200 low. Bitcoin price is still trading above $65,500 and the 100 hourly Simple moving average.
There is also a key bullish trend line forming with support at $65,700 on the hourly chart of the BTC/USD pair. The trend line is near the 50% Fib retracement level of the upward move from the $64,281 swing low to the $67,200 low.
Immediate resistance is near the $67,000 level. The first major resistance could be $67,200. The next resistance now sits at $68,500. If there is a clear move above the $68,500 resistance zone, the price could continue to move up. In the stated case, the price could rise toward $70,000.
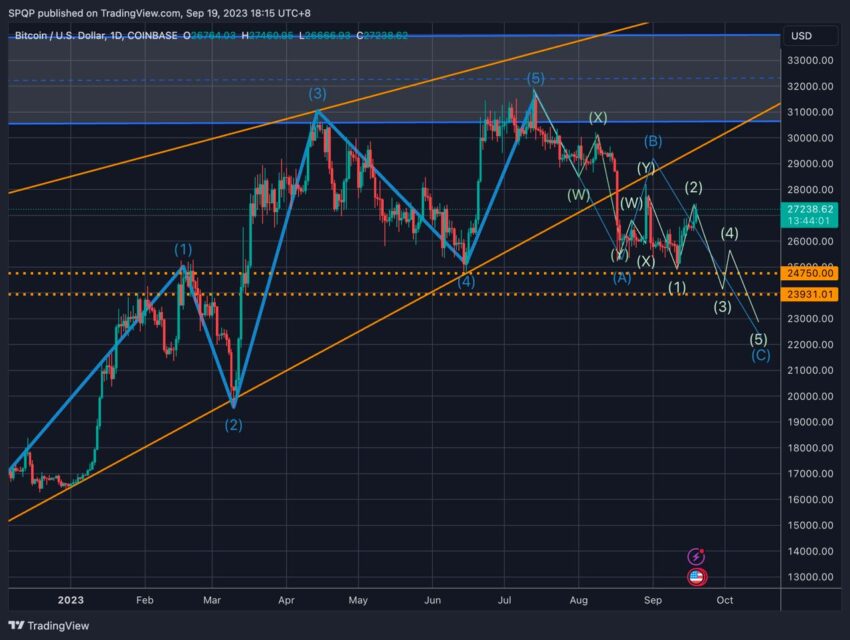
Source: BTCUSD on TradingView.com
The next major resistance is near the $70,500 zone. Any more gains might send Bitcoin toward the $72,000 resistance zone in the near term.
Downside Correction In BTC?If Bitcoin fails to rise above the $67,000 resistance zone, it could start a downside correction. Immediate support on the downside is near the $66,500 level.
The first major support is $65,700 or the trend line. If there is a close below $65,500, the price could start to drop toward $65,000. Any more losses might send the price toward the $64,200 support zone in the near term.
Technical indicators:
Hourly MACD – The MACD is now losing pace in the bullish zone.
Hourly RSI (Relative Strength Index) – The RSI for BTC/USD is now above the 50 level.
Major Support Levels – $66,500, followed by $65,500.
Major Resistance Levels – $67,000, $67,200, and $68,500.
origin »Bitcoin price in Telegram @btc_price_every_hour
Bitcoin (BTC) на Currencies.ru
|
|