2021-12-2 06:08 |
Bitcoin failed again to clear the $58,500 resistance against the US Dollar. BTC is declining and it might accelerate lower below the $56,000 support in the near term.
Bitcoin is struggling to move above the $58,000 and $58,500 levels. The price is just trading above $57,000 and the 100 hourly simple moving average. There was a break below a key bullish trend line with support near $57,200 on the hourly chart of the BTC/USD pair (data feed from Kraken). The pair could accelerate lower if there is a clear break below the $56,000 support zone. Bitcoin Price is StrugglingBitcoin price failed to gain pace above the $58,500 resistance zone. BTC is slowly moving lower from the last swing high at $58,890. There was a break below the $58,000 level.
The price traded below the 23.6% Fib retracement level of the upward move from the $53,300 swing low to $58,890 high. Besides, there was a break below a key bullish trend line with support near $57,200 on the hourly chart of the BTC/USD pair.
Bitcoin is now just trading above $57,000 and the 100 hourly simple moving average. An immediate resistance on the upside is near the $57,500 level. The first major resistance is near the $58,000 level.
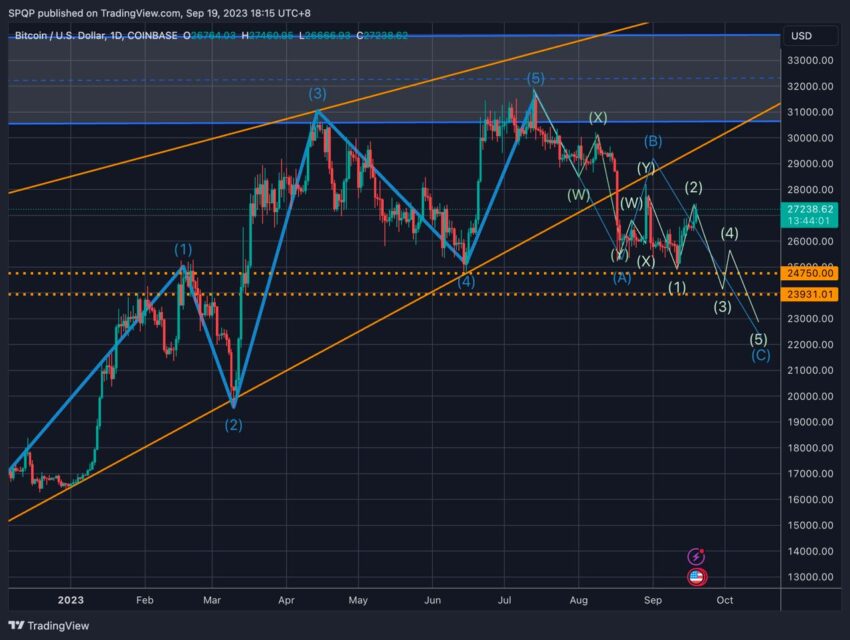
Source: BTCUSD on TradingView.comThe main resistance is still near the $58,500 level. A clear break above the $58,500 resistance zone could open the doors for more upsides. The next key resistance is near the $60,000 level, above which the price could rise steadily. The next stop for the bulls may possibly be near the $61,200 level.
Fresh Drop In BTC?If bitcoin fails to clear the $58,000 resistance zone, it could start a fresh decline. An immediate support on the downside is near the $57,000 level. The first major support is now forming near the $56,800 level and the 100 hourly SMA.
The next major support is near the $56,000 level. It is near the 50% Fib retracement level of the upward move from the $53,300 swing low to $58,890 high. A downside break below the $56,000 support may perhaps push the price towards $55,500. Any more losses might start a major decline towards $52,000.
Technical indicators:
Hourly MACD – The MACD is now gaining pace in the bearish zone.
Hourly RSI (Relative Strength Index) – The RSI for BTC/USD is currently below the 50 level.
Major Support Levels – $57,000, followed by $56,000.
Major Resistance Levels – $58,000, $58,500 and $60,000.
origin »Bitcoin price in Telegram @btc_price_every_hour
Bitcoin (BTC) на Currencies.ru
|
|