2020-10-31 18:30 |
The Swipe (SXP) price has reached the final support level before dropping towards its all-time lows.
While there are bullish signs in the short-term, indicating a potential breakout, the long-term trend remains bearish.
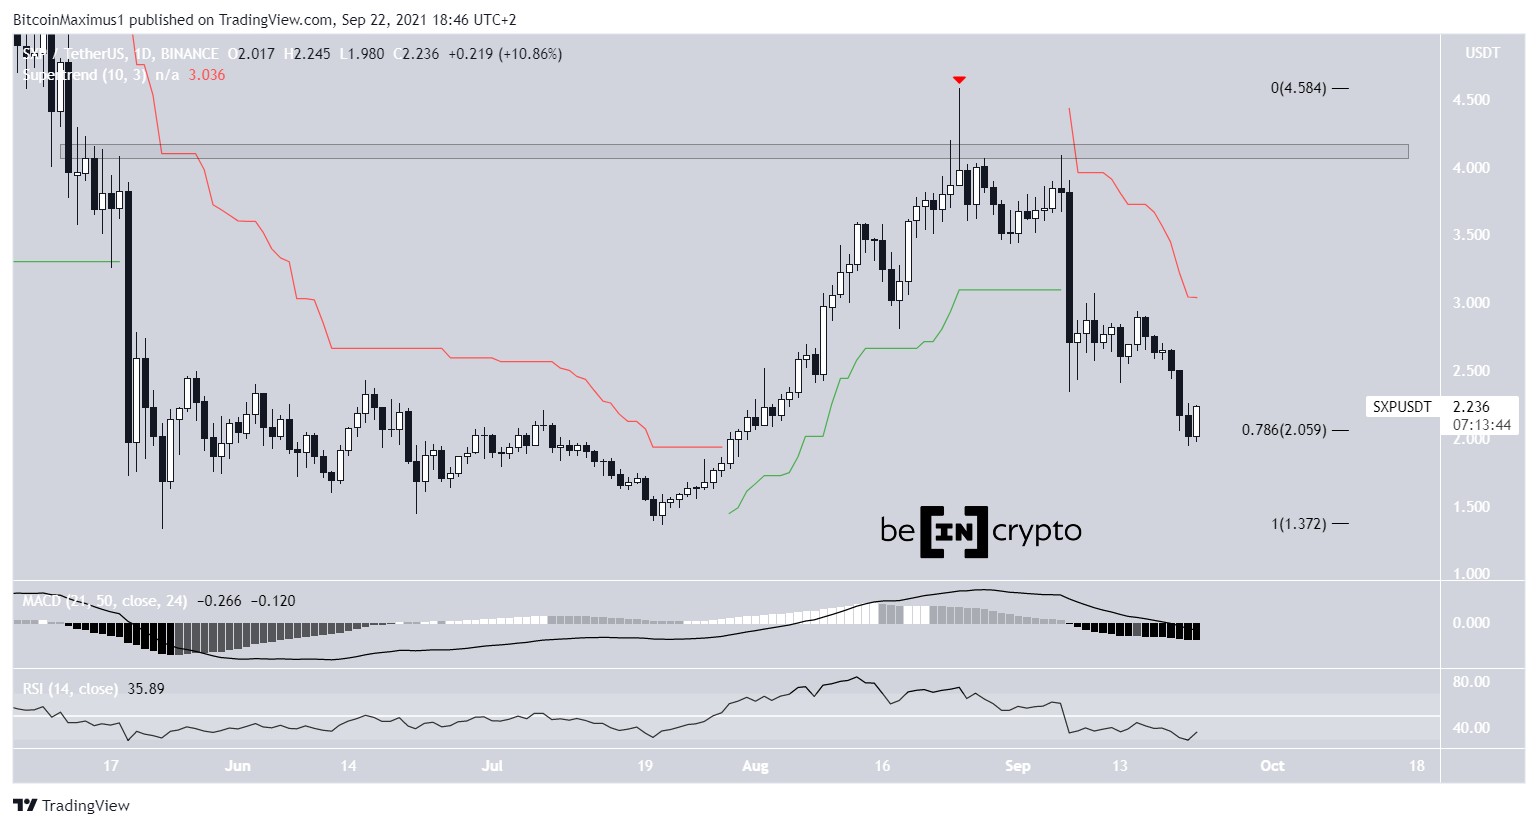
SXP Approaches Final SupportThe SXP price reached a high of $5.15 on Aug 13 and has been declining since. The price has fallen through multiple support levels after initiating numerous failed bounces.
At the time of writing, the price was trading near $0.75, the final support level before SXP heads towards new all-time lows.
Despite this, there are no reversal signs yet. On the contrary, the Stochastic Oscillator has made a bearish cross and is falling, and so is the MACD. While the RSI is in oversold territory, it has yet to form any type of bullish divergence.
SXP Chart By TradingView Short-Term PotentialThe shorter-term 6-hour chart shows that SXP has been following a descending resistance line since it reached a high on Sept 29. So far, the line has been validated four times.
There is some bullish divergence developing on the RSI that could cause a breakout. If the price were to break out, the closest resistance level would be found at $1.35.
However, until the price breaks out, the trend is bearish and SXP will likely continue lower.
SXP Chart By TradingViewThe 2-hour chart also supports this possibility, since there is a pronounced bullish divergence on both the RSI and the MACD.
Therefore, an upward move towards the descending resistance line seems likely. However, due to the bearishness from the daily time-frame, we cannot yet suggest that a breakout will occur.
SXP Chart By TradingView Wave CountCryptocurrency trader @TheEWguy outlined an SXP chart which shows a corrective structure that would take the price all the way to $1.90 – $2.
Source: TwitterSince the previous Aug 14 all-time high, the price seems to be nearing the end of a bearish five-wave formation (shown in black bel0w). The sub-wave count for wave 5 (blue) suggests that the price is in sub-wave 5, after which a considerable rally should follow.
This fits with the long-term support level outlined in the first section and the bullish short-term indicators and would be confirmed by a breakout above the descending resistance line.
If so, the price could rally towards the $1.90 – $2 target given in the tweet.
SXP Chart By TradingViewTo conclude, the SXP price should eventually break out from the current descending resistance line and initiate a correction towards $2.
For BeInCrypto’s latest Bitcoin analysis, click here!
Disclaimer: Cryptocurrency trading carries a high level of risk and may not be suitable for all investors. The views expressed in this article do not reflect those of BeInCrypto.
The post Swipe’s (SXP) Decline Might Be Coming to an End appeared first on BeInCrypto.
origin »Bitcoin price in Telegram @btc_price_every_hour
Swipe (SXP) на Currencies.ru
|
|