2020-9-10 14:00 |
Swipe (SXP) has been decreasing since reaching an all-time high on Aug 13.
The price is approaching a significant support level, however, and the bullishness from technical indicators suggests a reversal is near.
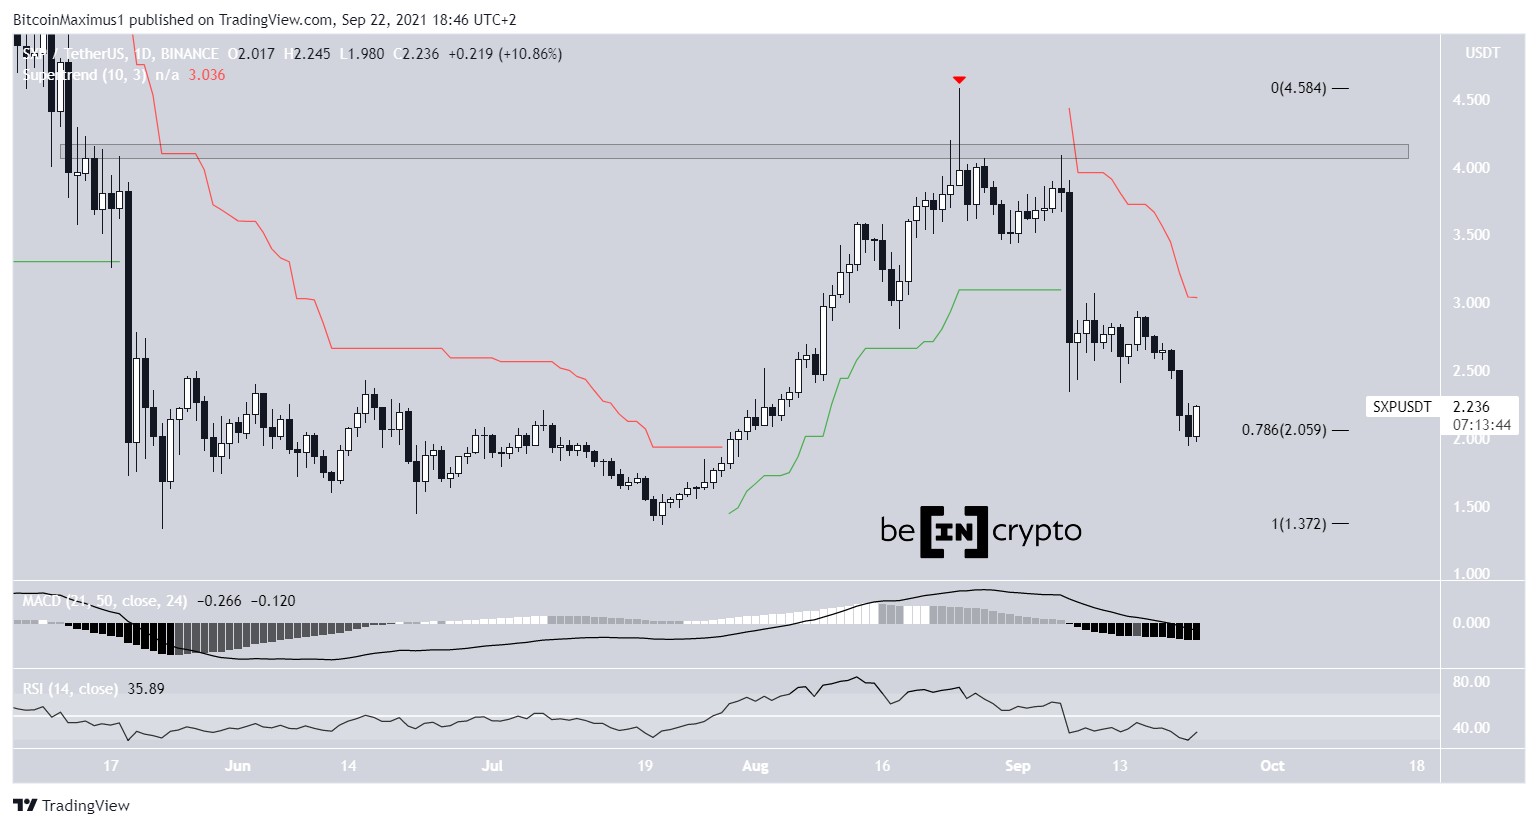
SXP Retraces to SupportThe SXP price has been decreasing since it reached a high of $5.15 on Aug 13. The price is approaching a major support level at $1.30, created by the beginning of the bullish engulfing candlestick on July 19 and the succeeding long lower-wicks.
Besides the fact that the price is nearing a strong support level, technical indicators in the daily time-frame have turned bullish:
The MACD is moving up and has given a bullish reversal signal. The Stochastic RSI has made a bullish cross and is moving upwards. The RSI has generated a bullish divergence.Therefore, the price is expected to soon complete its retracement and begin to move upwards.
SXP Chart By TradingViewCryptocurrency trader @Traderx0x0 outlined an SXP chart, stating that the price is likely not yet done correcting, giving a target of $1.20 before the price can possibly resume its upward movement.
Source: TwitterThe short-term chart shows a breakout from a descending resistance line (dashed in the chart below) and the price following another ascending support line (solid).
As long as SXP is trading above this support line, it is likely to continue increasing. A breakout and re-test of the $2.15 area as support would drastically reduce the chances of the price returning to validate the $1.30 support area.
SXP Chart By TradingView Wave CountBeginning from July 8, there is a very clear bullish impulsive five-wave formation (in black below) that can be outlined for SXP, which ended with the aforementioned high on Aug 13. Since then, SXP has been correcting alongside the majority of the market.
It’s worth noting that the price has reached the 0.786 Fib level of the entire correction at $1.50, which is a common retracement level for a correction to end.
SXP Chart By TradingViewA look at even shorter-term time frames reveals that the price is trading inside an A-B-C correction (black). The length of the wave C has been exactly 0.618 Fib lengths of wave A, which is a very common ratio between these two waves.
Combining this with the bullishness from the daily technical indicators, and possible shorter-term count (blue), it is more likely that SXP has already finished its correction and will soon begin to move upwards.
SXP Chart By TradingViewFor BeInCrypto’s latest Bitcoin (BTC) analysis, click here!
The post Swipe (SXP) Indicators Suggest a Reversal Is Inbound appeared first on BeInCrypto.
origin »Bitcoin price in Telegram @btc_price_every_hour
Swipe (SXP) на Currencies.ru
|
|