2025-6-25 20:53 |
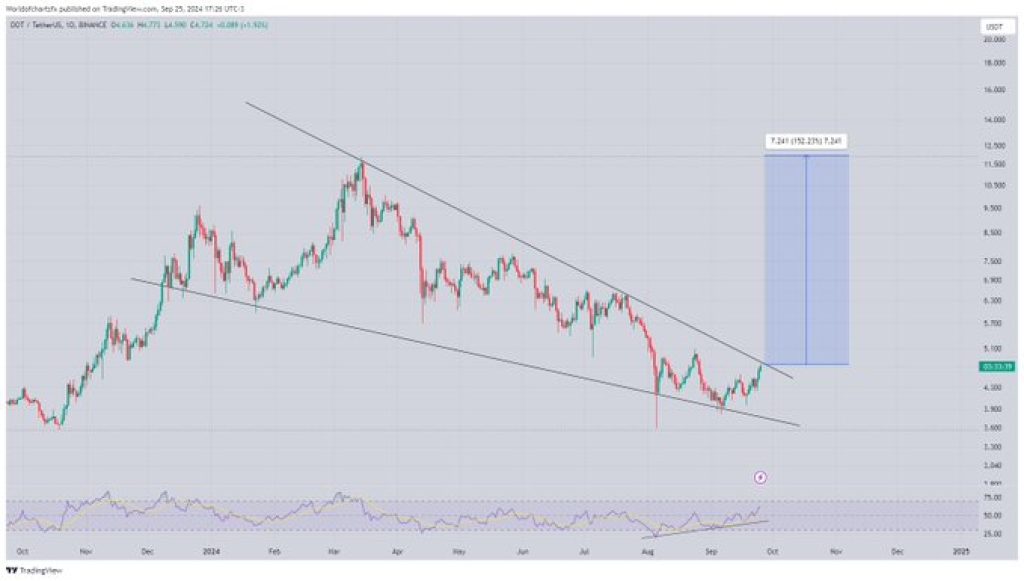
Analysts spot a falling wedge and declining volatility in Pi’s charts; signs that often precede bullish reversals. #partnercontent origin »
Bitcoin price in Telegram @btc_price_every_hour
PiCoin (PI) на Currencies.ru
$ 0 (+0.00% )
Объем 24H $0
Изменеия 24h: 0.00 % , 7d: 0.00 %
Cегодня L: $0 - H: $0
Капитализация $0 Rank 99999
Доступно / Всего 0 PI
|
|