2020-4-8 20:15 |
The Bitcoin price has been increasing since reaching a low on March 13. The increase has taken the form of an ascending wedge. In addition, it is possible that the price is following an A-B-C wave count.
Bitcoin trader @Mesawine1 outlined what he believes is the correct wave count in both short- and long-term time-frames for the Bitcoin movement. He believes that the price is in an upward A-B-C formation that is likely to end near $8,000.
$btc update:
Zooming in on last leg up. I think #btc is currently in a w4. needs to stay above the support of the major EMA's to maintain bullishness. If so imo target can be made.
Also note the hidden bullish div on RSI#bitcoin #crypto pic.twitter.com/71nWwjJ3YE
— Cryptotoad (@Mesawine1) April 7, 2020
Will the Bitcoin price be able to reach this target, or will it break down prior to doing so? Continue reading below if you are interested in finding out.
Wave CountThe A-B-C corrective wave count begins with the March 13 low of $3,850. If the count is correct, the Bitcoin price is currently in the process of completing the C wave, which is the final wave which completes the formation.
The sub-waves of this larger A-B-C wave are taking the form of a 5-3-5 formation, with the price currently being at the top of the third wave.
In the image below, the larger A-B-C formation is shown in green, while the sub-waves are being shown in red.
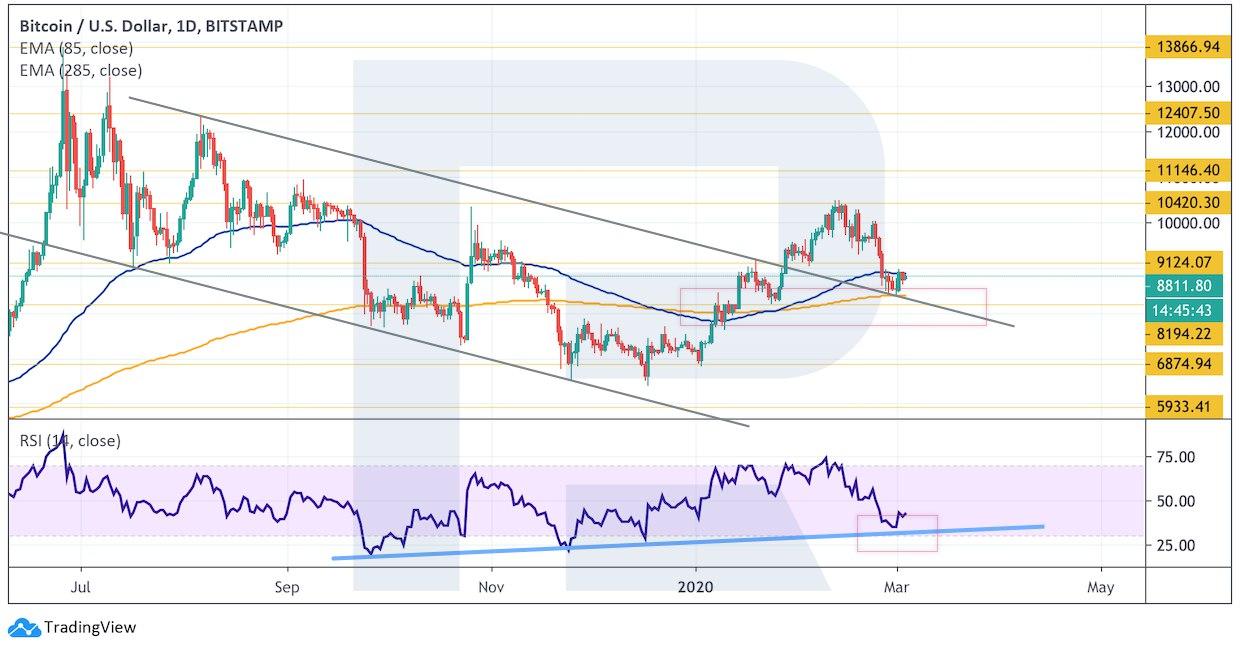
Bitcoin Chart By Trading View Likely TargetWe can use a Fibonacci retracement tool on the B wave in order to find the likely target for the top of this move, which is found at $8,000.
This target fits with the ascending wedge that the price is currently trading in. Since the resistance line is ascending, it will coincide with the target on April 16.
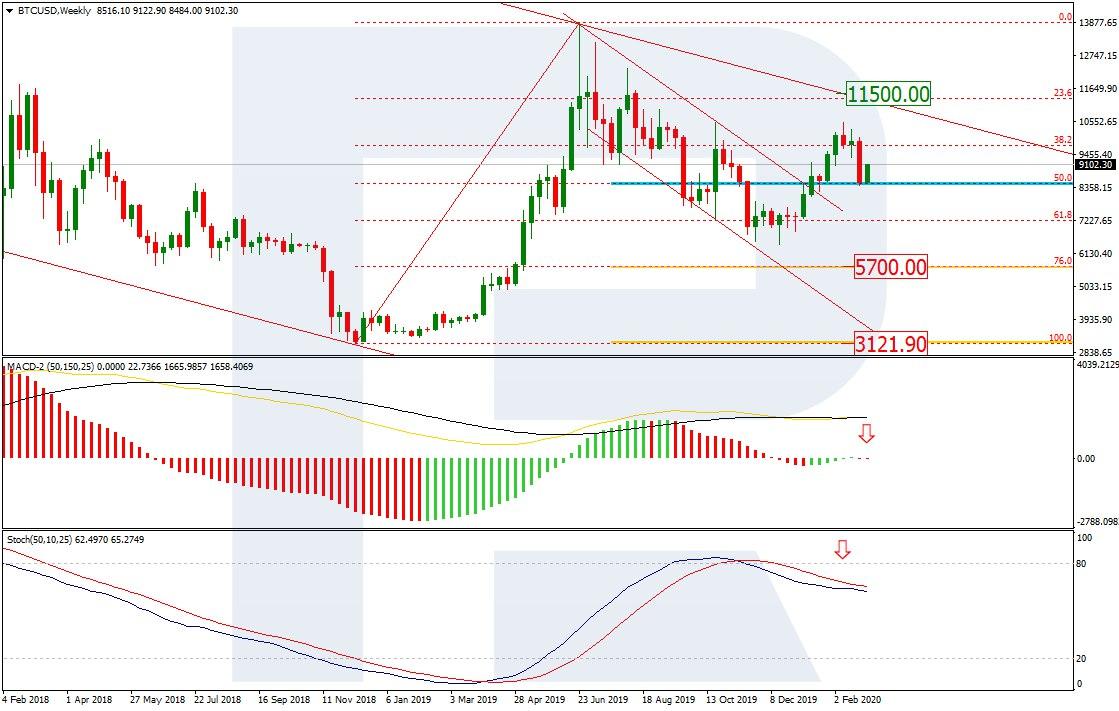
Bitcoin Chart By Trading View Long-Term MovementIn the long-term, it is likely that this entire A-B-C formation is the second wave of a five-wave Elliot formation, which creates the C wave of an A-B-C correction that began in July 2019.
If this entire formation is completed, the price would be expected to reach a low of $2,000-$2,200 in July. We outlined this possibility in more detail in our previous article.
Bitcoin Chart By Trading ViewTo conclude, the Bitcoin price is trading inside an ascending wedge and possibly completing an A-B-C formation. The $8,000 level is expected to act as the high for the C wave.
The post Outlining Bitcoin’s Wave Count Since the March 13 Bottom appeared first on BeInCrypto.
origin »Bitcoin price in Telegram @btc_price_every_hour
wave edu coin (WEC) на Currencies.ru
|
|