Endorsement - Свежие новости [ Фото в новостях ] | |

Binance Adds Tron’s BitTorrent BTT Trading Pairs to Three Stablecoins (TUSD, USDC and PAX)
The BTT Token by BitTorrent is only a few weeks old. Despite this, it has already gotten the endorsement of one of the biggest crypto exchanges in the world. Besides that, it has become quite popular in the crypto community. дальше »
2019-2-14 20:26 | |
|
|

Bitcoin Finally Bucks Trend and Rallies back above $3,600 Mark: BTCManager’s Week in Review February 11, 2019
The price of bitcoin rallied by five percent week-on-week after Twitter CEO Jack Dorsey, once again, spoke highly of the world’s leading digital currency and even held “the Lightning torch” on Twitter before passing it on to Lightning Labs co-founder Elizabeth Stark. дальше »
2019-2-12 16:00 | |
|
|

Bitcoin Price Analysis: Strong Rally Set to Test Overhanging Resistance
Shortly after the London Open, the entire crypto market saw a strong round of buying. Some coins broke their highest volume seen since the beginning of the bear market, and several others broke straight through overhanging resistance levels. дальше »
2019-2-9 01:45 | |
|
|
Ripple Price Analysis: XRP Reject Losses, IMF Economists Pro Crypto?
Ripple price stable, reject lower lows IMF proposes a duo cash system with virtual currencies and cash in circulation Transaction volumes low, likely to spike as prices recover Finally, IMF economists agree that there is a way governments can incorporate virtual currencies in their economies. дальше »
2019-2-7 21:00 | |
|
|
Bitcoin Price Analysis: Major Support Broken on Expanding Volume and Spread
After weeks of consolidation, bitcoin finally broke through support. The market now finds itself cruising toward prior lows. On expanding volume and spread, the bitcoin market appears ripe for a continuation of the downtrend:Figure 1: BTC-USD, Daily Candles, Broken SupportAlthough the current daily candle has yet to close, unless there is a strong influx of demand hitting the market, it stands to reason that bitcoin will be closing a new daily low for the first time since mid-December. дальше »
2019-1-29 02:01 | |
|
|
Tron Price Analysis: TRX—LTC Flap Likely, Weiss Ratings Endorsement
Tron price is up 16 percent from last week’s close Weiss Ratings endorse Tron, says platform popular Transaction volumes thin despite increasing volatility Of all the coins in the top 10, TRX is the most attractive. дальше »
2019-1-26 20:00 | |
|
|
Bitcoin Price Analysis: Strong Move Likely Following Tightly Coiled Market
Days and days of sideways consolidation and tightening volume has been the name of the game for the bitcoin market. A narrow range of $200 has caused a weeks worth of activity to coil and consolidate in preparation for bitcoin’s next move:Figure 1: BTC-USD, Daily Candles, Narrow RangeThe figure above shows just how narrow the range has been over the last week as the market has continued to grind out support and fail to break above overhanging resistance. дальше »
2019-1-26 03:13 | |
|
|
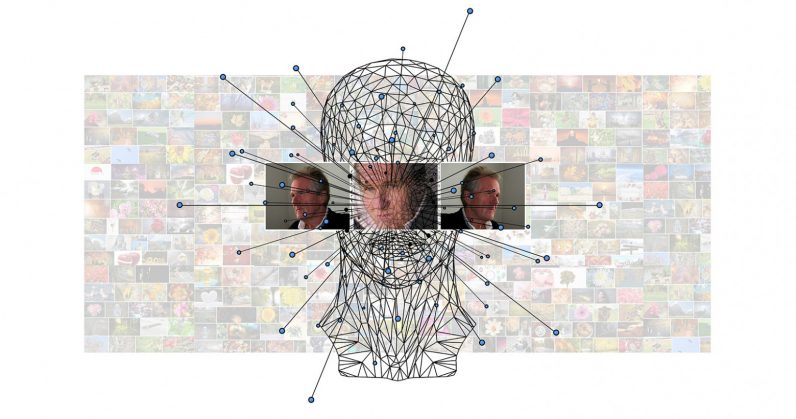
The FBI says its photo analysis is scientific evidence. Scientists disagree.
At the FBI Laboratory in Quantico, Virginia, a team of about a half-dozen technicians analyzes pictures down to their pixels, trying to determine if the faces, hands, clothes or cars of suspects match images collected by investigators from cameras at crime scenes. дальше »
2019-1-22 03:35 | |
|
|
Bitcoin Price Analysis: Bitcoin Tests Boundary Support as Demand Weakens
Following last Friday’s drop, bitcoin has found itself coiled, once again, at the bottom of the range it established back in December. With the current market unable to close a new high, the market finds itself in a precarious position:Figure 1: BTC-USD, Daily Candles, Range Support TestThe blue support level shown above illustrates the boundary of the multi-week range bitcoin has been bound by. дальше »
2019-1-18 02:02 | |
|
|
Bitcoin Price Analysis: Strong Impulse Tests Macro Support Levels
Finally, after about a week or so of a tight, range-bound market, bitcoin poked right through support. This swift move dropped the price nearly 10% in the span of just a few short hours:Figure 1: BTC-USD, Hourly Candles, 11% DropNot only did this move occur on high spread, it occured on high volume. дальше »
2019-1-12 02:21 | |
|
|
BREAKING: Another bank to start using Ripple’s XRP in the Q1 of 2019
XRP, the third largest cryptocurrency by market cap but first by amount of hate it gets, enjoys another official bank endorsement: Euro Exim Bank in London. This has been reported by the AmericanBanker. дальше »
2019-1-9 23:16 | |
|
|
Bitcoin Price Analysis: Range-Bound Market Coiled for Next Move
For the better part of a month and a half, bitcoin has been fairly range-bound and unable to establish new lows or new highs. There are some bullish and bearish setups on the horizon for bitcoin, so let’s check out both sides of the argument because currently the market is sitting in the middle of Indecisionville — the most immediate sign of which is this glaringly obvious head-and-shoulders bottom reversal pattern:Figure 1: BTC-USD, Daily Candles, Head-and-Shoulders BottomThis current pattern is nothing more than a setup at the moment, but it represents one potential outcome of this sustained consolidation. дальше »
2019-1-4 02:22 | |
|
|

Bitcoin Price Analysis: Strong Rally Tests Overhanging Resistance
Earlier this week, bitcoin enjoyed a strong and quick rally, spanning all the way from the low $3,100s to the upper $3,900s — in other words, a move that previously took the market weeks to make, this time took place in just a few short days. дальше »
2018-12-20 02:21 | |
|
|
Crypto Daily Recap for Dec 11th – Bitcoin ETF, TenX, CoinCola XRP, Kraken, Winklevoss Twins [VIDEO]
Bitcoin Gets Experts' Endorsement as Alternative to Quantitative Easing Bitcoin Gets Experts' Endorsement as Alternative to Quantitative Easing Reasons Why Even the Most Supporting Players of Crypto Don't Want Bitcoin ETF Approval Reasons Why Even The Most Supporting Players Of Crypto Don't Want Bitcoin ETF Approval Only Two ASIC Bitcoin Mining Machines Are Still Profitable […] дальше »
2018-12-12 10:39 | |
|
|
Bitcoin Price Analysis: Bear Pennant Breakout Puts $1,700 Price in Sight
Another week, another low. Bitcoin’s market has been bleeding relentlessly for weeks and now, after falling 50% in value in just one month, the market has managed to break south of a major bearish consolidation pattern called a bear pennant:Figure 1: BTC-USD, 4-Hour Candles, Bear Pennant BreakoutThis is a massive bear pennant with a staggering $2,000 measured move. дальше »
2018-12-12 01:52 | |
|
|
Bitcoin Price Analysis: Wait and See Where Recent Signs of Strength Lead
This week realized a big gain as bitcoin enjoyed a 25% rally from its local bottom before topping out around $4,400. Support currently appears to be established in the mid-$3,000s as the market remains indecisive over its next move:Figure 1: BTC-USD, Daily Candles, Current Support LevelFigure 1 shows the relevance of the current support level as it represents a previous support level that was never properly retested during last year’s parabolic bull market. дальше »
2018-11-30 01:45 | |
|
|
Ether Price Analysis: Untested Support Leaves Shaky Foundation During Drop
Much like the rest of the crypto market, ether has found itself devalued by more than 90% since its all-time high of $1,400 back in December of 2017. And now, almost a year later, ether sits just above $100 on what appears to be shaky ground during its latest round of selling over the last few weeks:Figure 1: ETH-USD, Daily Candles, Rapid DescentSimilar to bitcoin’s movement discussed in yesterday’s article, ETH-USD experienced a parabolic growth profile during its bull run. дальше »
2018-11-28 01:55 | |
|
|

Gibraltar's Regulator Grants Full License to the Gibraltar Blockchain Exchange
The Gibraltar Blockchain Exchange (GBX) has been granted a license from the Gibraltar Financial Services Commission (GFSC) required to operate a regulated blockchain exchange. дальше »
2018-11-23 23:44 | |
|
|
Bitcoin Price Analysis: Another Red Day Pushes BTC Into Deeper Support Test
Bitcoin has tumbled again today as the market continues to see further downward movement shortly after breaking two areas of market support. So far, bitcoin is down 15% on the day — 25% in 1 week:Figure 1: BTC-USD, Daily Candles, Downward ContinuationThis drop below support is starting to display hallmarks of market capitulation. дальше »
2018-11-20 02:27 | |
|
|
Soccer Legends Limited Blockchain Crypto Project Receives Paul Scholes’ Endorsement
Soccer Legends LTD is a Hong Kong blockchain based startup that is looking to incorporate soccer into blockchain. Soccer or football happens to be one of the most popular sports across the globe. The company hopes to do this through the use of a project that will lead to the introduction of a token aimed […] дальше »
2018-11-17 23:44 | |
|
|
Bitcoin Price Analysis: Yearly Support Breaks as Bitcoin Tests Underlying Demand
After months and months of consolidation, the yearly support finally broke and now bitcoin has found itself in the lower $5000s for the first time since 2017:Figure 1: BTC-USD, Daily Candles, Broken SupportBitcoin managed to drop a staggering 16% yesterday as the market sliced through the long held support like a knife through butter. дальше »
2018-11-16 01:28 | |
|
|

Colorado and California Just Elected Pro-Bitcoin Governors
Following the 2018 midterm elections, the U. S. will see two new pro-Bitcoin governors sworn into office. Jared Polis (D-CO) and Gavin Newsom (D-CA) both won out against their respective Republican contenders last night, November 6, 2018. дальше »
2018-11-7 20:44 | |
|
|

Gwyneth Paltrow’s ‘endorsement’ of cryptocurrency is a shameless ad
Fresh off its false advertising controversy, Gwyneth Paltrow’s lifestyle brand Goop is now encouraging people to learn more about the fundamentals of Bitcoin and cryptocurrency – and how they can make their first investment. дальше »
2018-11-6 17:24 | |
|
|
JP Morgan: “We Are Big Believers in Ethereum”
Despite recent statements by Jamie Dimon, in which he claimed that he didn’t “give a sh*t about Bitcoin. ” JP Morgan just gave a significant endorsement to Ethereum ETH as a result of its capabilities to provide practical applications in the world of finance. дальше »
2018-11-3 04:20 | |
|
|
Bitcoin Price Analysis: Weekly Consolidation Hints Toward Sustained Breakout
Another week has passed as bitcoin continues to coil in a tighter and tighter consolidation. Both price and volume continue to consolidate as bitcoin decides where the next major move will be. дальше »
2018-10-31 00:19 | |
|
|
Cardano Price Analysis October 26th: ADA Bulls Could See Gains Above 9.5 cents
Straight from Algorand endorsement by Charles Hoskinson to Trezor’s support of ADA, the ground is set for ADA/USD rally. All things constant, we maintain a bullish outlook. Regardless, we still retain a neutral stand for now until after prices edge past 9. дальше »
2018-10-26 16:26 | |
|
|

SEC Investigates Nevada Company Over False Regulatory Claims
Investors should be wary of any company launching an ICO and claiming SEC endorsement or regulatory compliance.
дальше »2018-10-23 00:59 | |
|
|
Ether Price Analysis: Historic Support Tested Amid Signs of Distribution
It’s been weeks since ether has seen a new high or a new low and the market has found itself range-bound. At the moment, we are seeing signs of distribution as large rounds of selling have remained present during key support tests:Figure 1: ETHUSD, 4 Hour Candles, Trading RangeSo far, for the last few weeks, ether has seen a trend of higher lows and low highs (the converging red trendlines). дальше »
2018-10-20 01:31 | |
|
|
Goldman Sachs and Billionaire Mike Novogratz Invest $15 Million into Crypto Custody Firm BitGo
Goldman Sachs Group Inc. and former Goldman partner Mike Novogratz have have executed a joint $15 million investment into cryptocurrency custodian BitGo Holdings Inc. The group’s contribution makes up over a quarter of the total $57. дальше »
2018-10-19 02:55 | |
|
|
XRP Price Analysis: FSB Subtle Endorsement of Ripple Positive for XRP
After Cory Johnson revelation that they have been in constant communication with the Trump administration, Ripple supporter should interpret this as positive. It appears as if this positivity is spreading. дальше »
2018-10-17 05:00 | |
|
|
Bitcoin Price Analysis: Bitcoin Consolidation Forecasts $3,500 Move
A strong round of buys hit the market this weekend as unsubstantiated rumors began to circle surrounding Tether and Bitfinex’s potential insolvency. I won’t be going into the details surrounding the allegations because, like I said, they are nothing more than unsubstantiated rumors. дальше »
2018-10-17 01:03 | |
|
|
Yale University Delves Into Cryptocurrency Market
U. S. Ivy League school Yale University has allocated money from their sizable endowment to invest in digital asset investment fund Paradigm, Bloomberg reports. An Ivy League Endorsement Paradigm was started by Fred Ehrsam, co-founder of Coinbase, along with Mark Huang of Sequoia Capital and Charles Noyes, formerly of Pantera Capital. дальше »
2018-10-6 13:00 | |
|
|
Game Developer Ubisoft Gives Blockchain-Based Gaming its First Major Endorsement
Blockchain-based gaming is a step closer this week on news that gaming giant Ubisoft has joined Fig, EverdreamSoft, ConsenSys, and others to form the Blockchain Game Alliance. The group’s goal is to spread the integration of blockchain technology in gaming. дальше »
2018-10-5 06:44 | |
|
|
Ether Price Analysis: Higher Lows Could Yield Retest of Local High
After two back-to-back weeks of record-setting volume, ether finds itself situated below historic resistance and currently unable to reach its downtrend line:Figure 1: ETH-USD, Weekly Candles, Downtrend and Record-Setting VolumeFor months, ether has been unable to break its downward trend. дальше »
2018-10-4 23:55 | |
|
|
Walmart Further Embraces Blockchain Tech Now Applying It for Tracking Food
American-born retail giant famed for general endorsement of the cutting-edge technologies is welcoming a blockchain-based replacement of the outdated food tracking system. The post Walmart Further Embraces Blockchain Tech Now Applying It for Tracking Food appeared first on CoinSpeaker. дальше »
2018-9-26 22:26 | |
|
|
Bitcoin Price Analysis: Potential Reaccumulation Could Test Bear Trend
Last week, after a devastating move that shook the market violently up and down for a 7% move in just a few short minutes, bitcoin saw a major sign of strength as it proceeded to have a slow, but steady markup where it managed to establish a local high in the $6,800s:Figure 1: BTC-USD, Hourly Candles, Shakeout Prior to MarkupThis shakeout forced the market to temporarily establish a new monthly low in what could be argued to be a stop-hunt prior to the move to the $6,800s. дальше »
2018-9-24 21:29 | |
|
|

Bittrex Forms Bittrex International, Announces New Digital Asset Platform in Malta
Seattle-based Bittrex is expanding its reach as a blockchain powerhouse, unveiling plans to launch an affiliate company, called Bittrex International. The addition will aim to play a role as cryptocurrency influencer to streamline blockchain adoption on a global scale. дальше »
2018-9-11 12:00 | |
|
|
Ether Price Analysis: Market Indecision Could Cause Short Covering Rally
When we last discussed the ETH-USD pair, the price was testing support in the mid $200 range. Since then, the market has dropped another 30% as ether tests the waters in the upper $190 range:Figure 1: ETH-USD, 1-Day Candles, Macro TrendThe volume on the current drop has been exceptionally high compared to the beginning of its descent from the $800s. дальше »
2018-9-11 01:02 | |
|
|
Bitcoin Price Analysis: Strong Rally Tests Trend-Changing Behavior
In a potentially trend-changing move, bitcoin has now managed establish its first *higher* low since the beginning of this years crypto bear market. In mid-June, after seeing a short-lived bounce from this year’s low in the upper $5,000s, the bitcoin market took a very harsh, unrelenting move that dropped the price from the mid $8000s to the $5900s. дальше »
2018-9-4 00:27 | |
|
|
Bitcoin Price Analysis: High Shorts Count Could Signal Price Hike
Once again, bitcoin finds itself precariously perched on the bottom of its macro trading range (TR). After a strong round of selling over the course of two weeks plunged the price back to the $6,000s, bitcoin began consolidating for several weeks at the bottom of the TR:Figure 1: BTC-USD, 1-Day Candles, Macro TRAs shown in the figure above, the market has interacted several times at the current price range and it has been a source of three major bullish rallies. дальше »
2018-8-25 00:42 | |
|
|

Ether Price Analysis: Historic Support Breaks, Leads to Signs of Capitulation
In two short weeks, ETHUSD has devalued by 50% of its market value. With little to no relief for the underwater bulls, ether seems to be accelerating downward as buyer confidence is lacking and showing signs of capitulation. дальше »
2018-8-15 01:10 | |
|
|

It’s Finished For This Finnish Bitcoin Scam
It is rare that Finland and Bitcoin scams are mentioned in the same sentence, according to reports from today though, this certainly seems to be the case, in an event that has seen a famous Thai actor by the name of Jiratpisit Jaravijit, scam 22-year-old Aarni Otava Saarimaa out of a large amount of Bitcoin. дальше »
2018-8-13 12:30 | |
|
|

Australian Cricket star Enrages fans with “Controversial” ICO Endorsement
Former Australian international cricket captain, Michael Clarke, has become embroiled in a spot of controversy after he publicly endorsed an ICO for Global Tech, a new Australian cryptocurrency exchange. дальше »
2018-8-12 03:00 | |
|
|

Twitter Takes a Swing at Former Cricketer for ICO Endorsement
Another day, another celebrity-endorsed ICO. This time, it’s one of Australia’s most well-known cricketers, Michael Clarke. However, cricket fans on Twitter have their own take. Many believe that celebrities lend a certain degree of credence and authenticity to the brands that they endorse. дальше »
2018-8-11 13:00 | |
|
|

Kim Kardashian Becomes a Bitcoin Holder – Receives First At ‘Charity Poker Tournament’
Kim Kardashian, a social media celebrity, recently posted pictures of a physical Bitcoin on her Instagram account. The attention given by a huge social media star could help in bringing some more mainstream attention to the world of cryptocurrencies. дальше »
2018-8-1 15:34 | |
|
|