2022-5-19 21:30 |
Despite bouncing at a confluence of long-term support levels, technical indicators for Near Protocol (NEAR) do not show any bullish reversal signs.
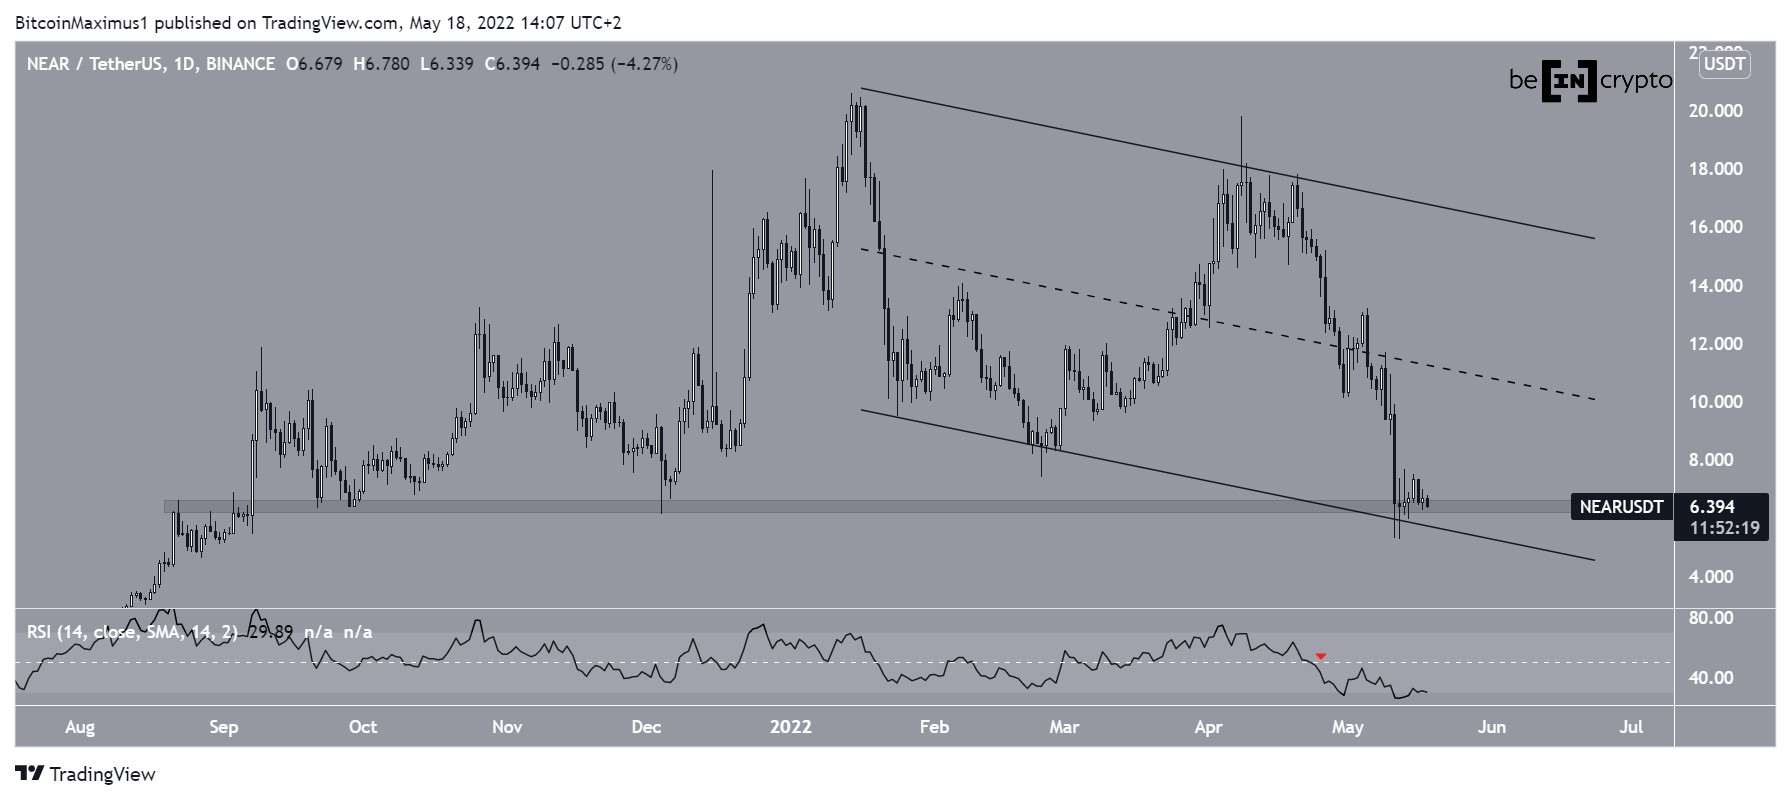
NEAR has been falling since reaching an all-time high price of $20.59 on Jan. 14. The price created a lower high on April 8 and has been falling at an accelerated rate since.
It is possible that the entire downward movement has been contained inside a descending parallel channel. Such channels usually contain corrective structures.
If the channel is in place, then the price bounced at its support line on May 11. The bounce also coincided with the $6.40 horizontal support area. As a result of this confluence, the $6.40 region is considered to be a very strong support area. A breakdown from it could be the catalyst for the acceleration of the downward movement.
However, despite the slight bounce, technical indicators are bearish. This is especially visible in the weekly RSI, which has decreased below 50 (red icon). Even though the indicator is now in oversold territory, it has not generated any bullish divergence.
NEAR/USDT Chart By TradingViewCryptocurrency trader @PostyXBT tweeted a chart of NEAR, stating that if the $6.40 area fails to hold, the downward movement is expected to continue.
Source: Twitter Short-term NEAR movementThe daily RSI readings are almost identical to the weekly ones. While the indicator is oversold, it has not generated any bullish divergence. Furthermore, it has been decreasing alongside a descending resistance line since the beginning of April.
Until it manages to break out from it, the ongoing bounce cannot be considered a trend reversal.
NEAR/USDT Chart By TradingViewFinally, the two-hour chart shows that NEAR has broken down from a symmetrical triangle. While the symmetrical triangle is considered a neutral pattern, it usually results in breakdowns when it is created after a downward movement.
Additionally, the RSI is bearish. It has broken down from an ascending support line and validated the 50 line as resistance (red icon). As a result of these readings, the two-hour chart suggests that the downward movement is likely to continue.
A breakdown from the long-term $6.40 horizontal support area is possible
NEAR/USDT Chart By TradingViewFor BeInCrypto’s latest Bitcoin (BTC) analysis, click here
The post Make or Break as Near Protocol (NEAR) Holds on at Support of Long-Term Channel appeared first on BeInCrypto.
origin »Bitcoin price in Telegram @btc_price_every_hour
NEAR Protocol (NEAR) на Currencies.ru
|
|