2023-8-17 13:30 |
The Litecoin (LTC) price had fallen since the beginning of July when it deviated above the $100 horizontal resistance area.
The LTC price has reached a long-term ascending support line that has been in place for more than a year. Whether it breaks down or bounces can determine the future trend.
Litecoin Price Falls After Deviation Above ResistanceThe weekly timeframe technical analysis provides a bearish outlook due to both the price action and indicator readings.
The price action is bearish since LTC failed to sustain its July breakout. The price briefly moved above the $100 mark (red circle) but fell below it shortly afterward.
This confirmed the $100 area as resistance and initiated a downward movement that is still ongoing. Moreover, it confirmed that the breakout was illegitimate. Sharp downward movements usually follow such deviations.
The LTC price now trades at an ascending support line that has existed for 427 days. Since the line has been in place for such a long time, whether Litecoin bounces or breaks down can determine the future trend.
A breakdown from the line could trigger a 20% drop to the $64 support area, while a bounce can initiate a 33% increase to the $100 resistance.
Crypto investing, simplified. Get LTC price predictions here.
LTC/USDT Weekly Chart. Source: TradingViewFurthermore, the weekly Relative Strength Index (RSI) reinforces the idea of an ongoing downtrend. Traders utilize the RSI to assess momentum and determine if a market is excessively bought or sold. This aids in deciding whether to retain or sell an asset.
When the RSI reading is above 50 and coincides with an upward trend, it typically favors bullish sentiment. Conversely, a reading below 50 indicates the opposite.
The RSI has recently dropped below 50, subsequent to displaying a bearish divergence (represented by the green line) during the previous deviation.
This phenomenon arises when a decline in momentum accompanies a rise in price. It further underscores the potential for a bearish trend.
Check Out the Best Upcoming Airdrops in 2023
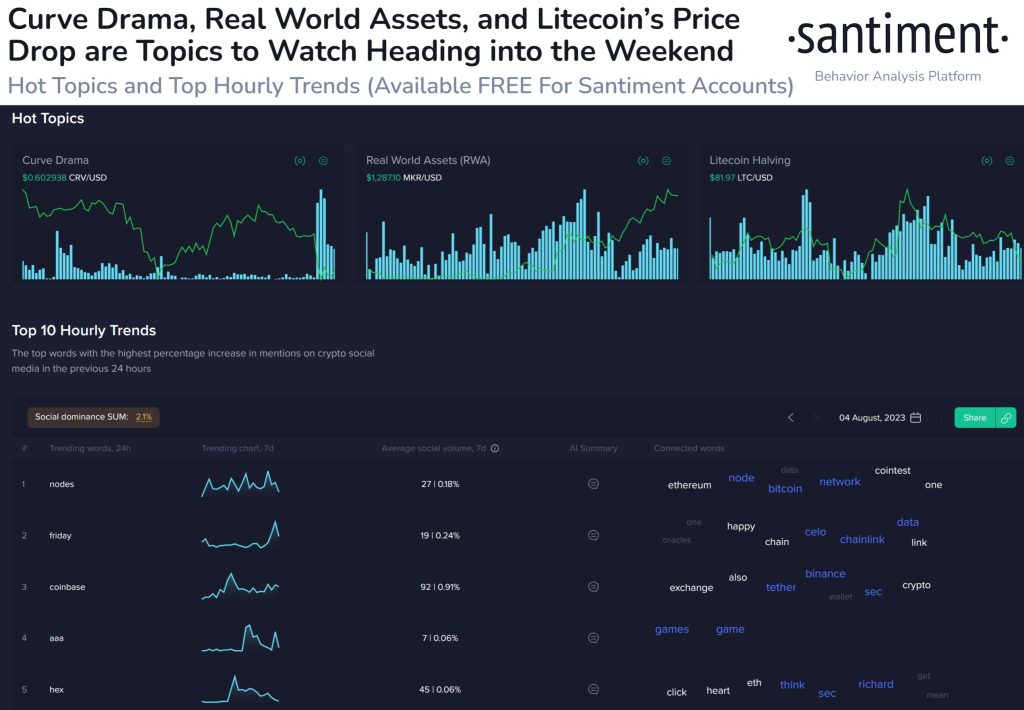
LTC Price Prediction: Will Price Save Breakdown?Litecoin experienced its third halving event on August 2, which reduced LTC block rewards from 15 to 6.25. This change increased the scarcity of the asset.
Despite the deflationary nature of the halving, the price of LTC declined in the week following this event. It’s plausible that miners instigated the sell-off.
Despite this decline, there’s potential for a rebound in LTC’s price. Since early February, Litecoin has been trading within an ascending parallel channel. The price has fallen slightly below the channel’s support line.
However, since it has not decisively closed below it, the possibility that it will reverse and reclaim it remains valid. Moreover, the fact that the channel’s support line aligns with the long-term ascending support line increases its importance.
Furthermore, the wave count supports the idea of a possible local bottom. Analysts who employ the Elliott Wave theory study recurring long-term price patterns and investor psychology to determine a trend’s direction.
It’s conceivable that the movement confined within the channel is part of a larger corrective structure labeled A-B-C (black). If this is accurate, waves A and C would have an exact 1:1 ratio, a commonly observed proportion in such structures.
If this interpretation holds, a substantial LTC price rebound could be anticipated from the channel’s support line, potentially driving the price toward the resistance area at $100.
However, a decisive close below the channel would invalidate this wave count and might lead the price to the previously mentioned support at $64.
LTC/USDT Daily Chart. Source: TradingViewHence, the prediction for LTC’s price hinges on whether it breaks down from the long-term ascending support line and channel or experiences a bounce.
A successful rebound could trigger a 30% surge to reach $100, while a breakdown could result in an 18% decline to the $64 level.
Check Out the Top 11 Crypto Communities To Join in 2023
For BeInCrypto’s latest crypto market analysis, click here
The post Litecoin (LTC) Price Tests Long-Term Support Line: Rebound or Breakdown? appeared first on BeInCrypto.
origin »Bitcoin price in Telegram @btc_price_every_hour
Litecoin (LTC) на Currencies.ru
|
|