2021-6-16 20:05 |
ICON (ICX) has been increasing since bouncing at a long-term support area on May 19.
However, the bounce has been weak, and the token is trading inside a short-term bearish pattern.
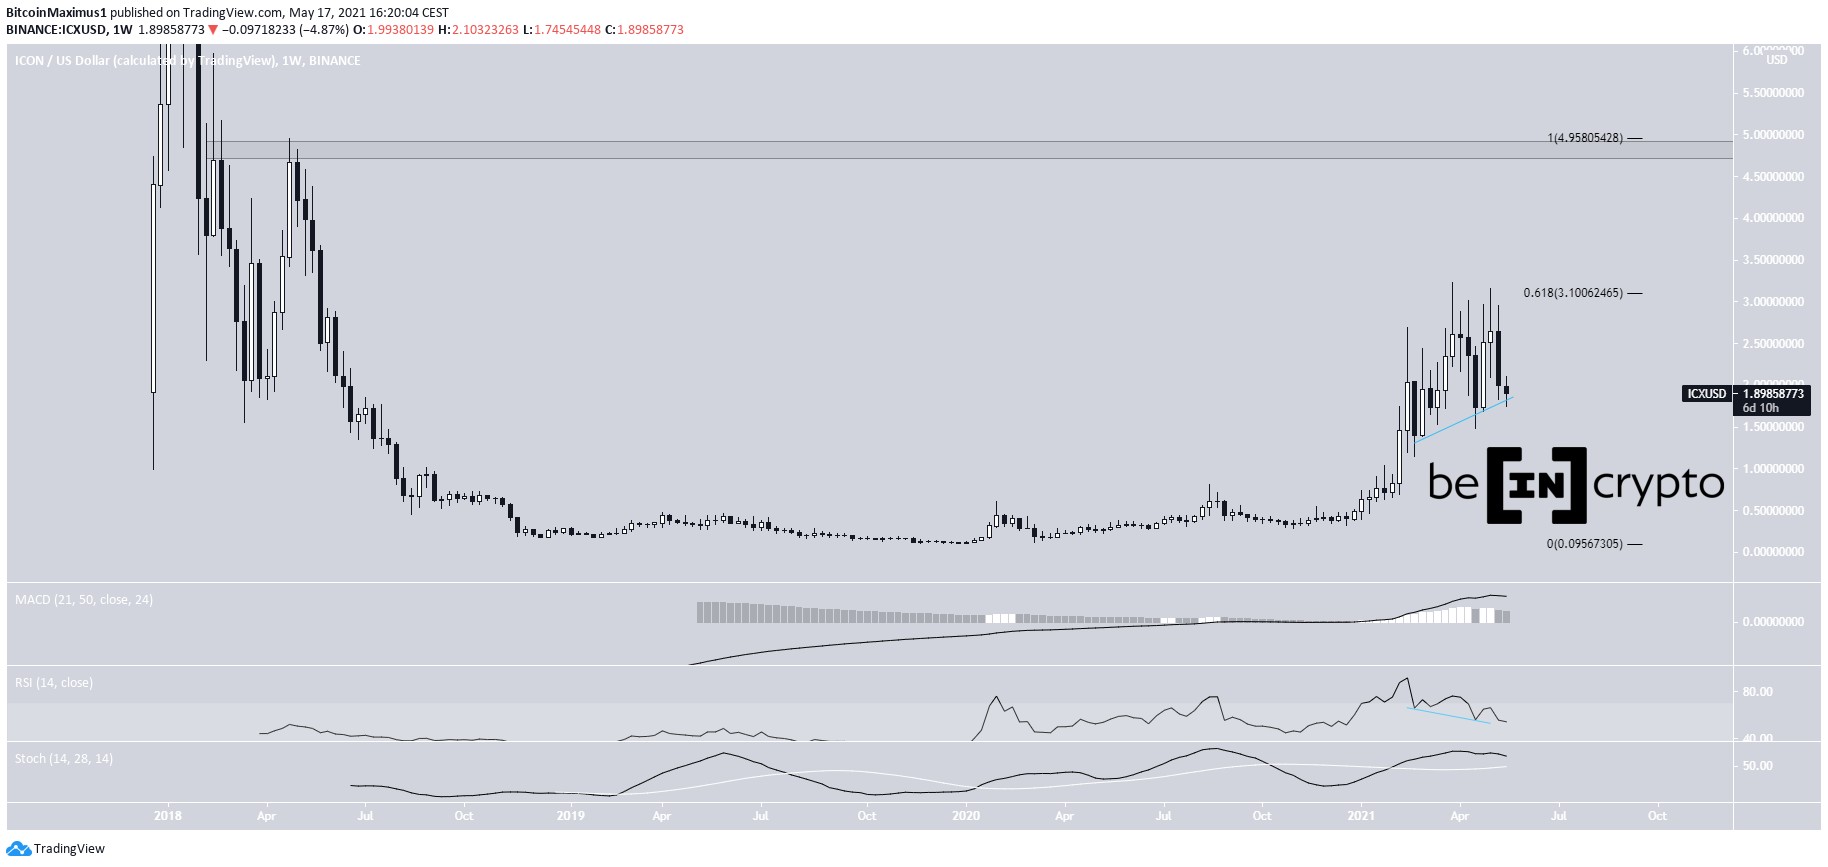
ICX bounces at long-term supportICX has been decreasing since reaching a high of $3.23 on March 31. The rejection occurred at the 0.618 Fib retracement resistance level of $3.11 (white). The token created a lower high on May 7 before accelerating its rate of decrease.
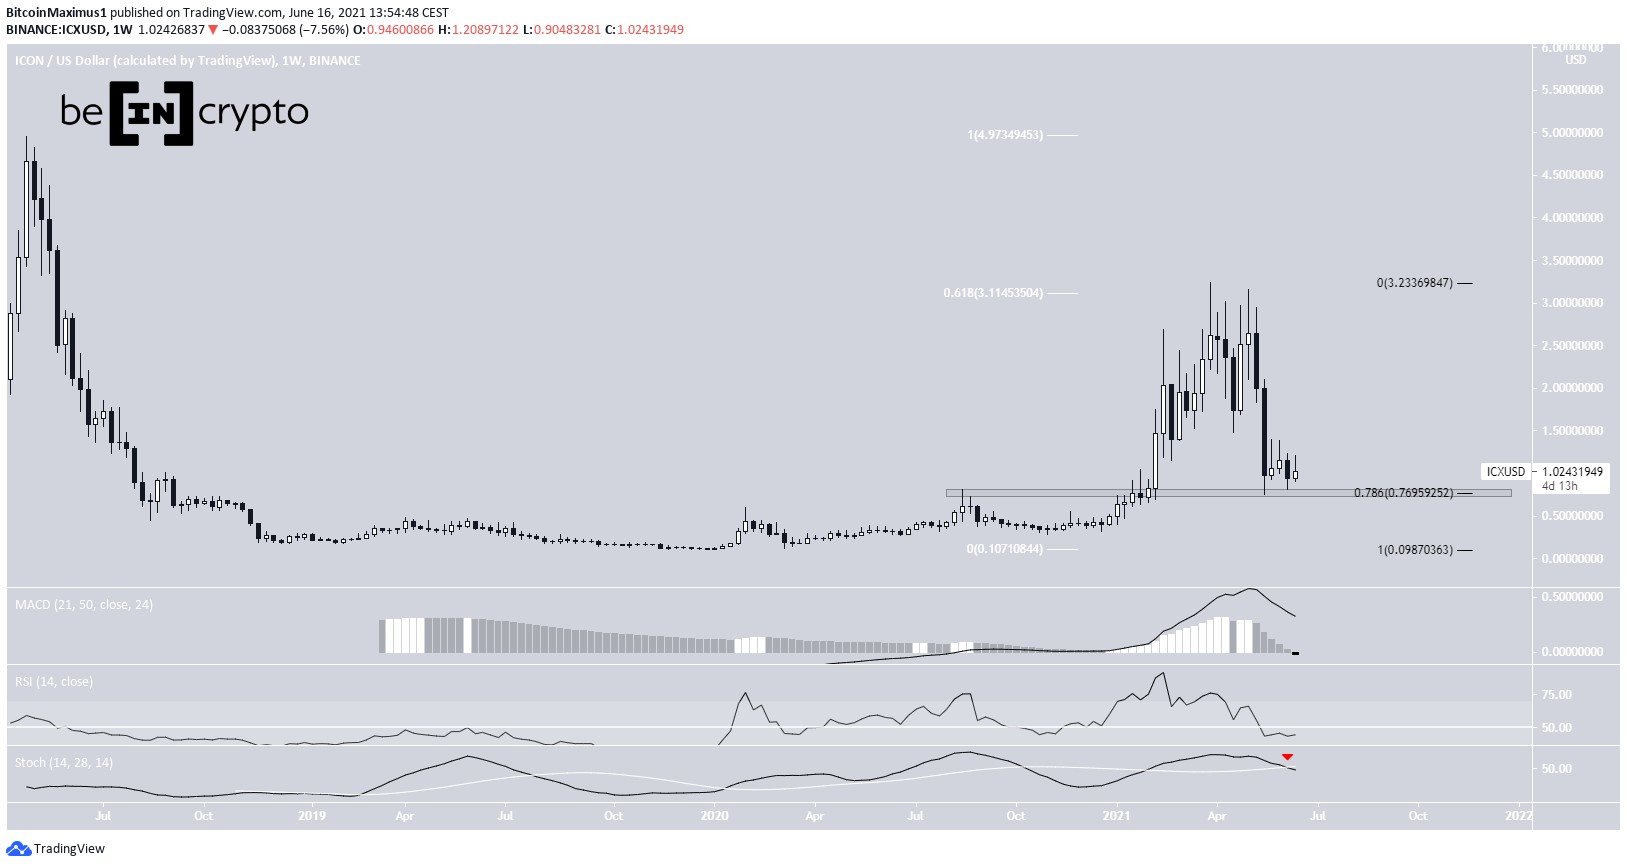
The drop culminated with a low of $0.75 on May 19. This served to validate the $0.77 area as support. This is a horizontal area that previously acted as resistance. In addition, it is the 0.786 Fib retracement support level (black).
While ICX has bounced since, the upward movement has been weak. In addition, technical indicators are bearish. The RSI, MACD & Stochastic oscillator are all decreasing. The RSI is below 50 and the Stochastic oscillator has made a bearish cross (red icon).
Therefore, it is likely that the long-term trend is still bearish.
Chart By TradingView Short-term movementWhile the daily chart provides a slightly more bullish outlook, it is still giving mixed signs, which are not sufficient in order to predict a reversal.
While the MACD is increasing, it is still negative. The RSI generated bullish divergence (blue line) but has followed that with hidden bearish divergence (red). Therefore, It is not enough to predict a bullish reversal.
Chart By TradingViewFinally, the two-hour chart shows a descending triangle, which is considered a bearish pattern. In addition, both the MACD & RSI are bearish.
Therefore, a breakdown would be more likely.
Chart By TradingView ICX/BTCCryptocurrency trader @Mesawine1 outlined an ICX/BTC chart, stating that it could be in a Wyckoff accumulation pattern. After another drop, he expects an upward movement to transpire.
Source: TwitterICX/BTC has been decreasing since it was rejected by the 5,400 satoshi resistance area on May 7.
Long-term indicators are bearish, supporting the decrease towards the closest support area at 1,600 satoshis. This is especially evident by the RSI movement below 50 and the impending bearish cross (red circle) in the Stochastic Oscillator.
While it is too early to determine if ICX will complete its Wyckoff accumulation after reaching it, it seems likely that it will first drop towards this level.
Chart By TradingViewFor BeInCrypto’s latest bitcoin (BTC) analysis, click here.
The post ICX Continues Descent After Rejection From Long-Term Resistance appeared first on BeInCrypto.
origin »Bitcoin price in Telegram @btc_price_every_hour
ICON (ICX) на Currencies.ru
|
|