Новости о Pattern Above [ Фото новости ] [ Свежие новости ] | |

Bitcoin (BTC): A Method To The Madness
Bitcoin (BTC) does not just go up and down, breaks supports and resistances based on sudden whims. Most traders are so focused on the 15 min chart that they miss the big picture. They fail to realize that major trading on exchanges is done by algorithmic bots. дальше »
2018-10-15 21:30 | |
|
|
Ethereum Classic (ETC) Can Easily End The Year Above $100
Ethereum Classic (ETC) is highly likely to trade north of $100 by end of the year. This does not require a very bullish Bitcoin (BTC). In fact, if Bitcoin (BTC) trades around $10,000, that would do the job for Ethereum Classic (ETC). дальше »
2018-10-12 17:30 | |
|
|
Eos (EOS) Investors Unmoved By Bitcoin (BTC) Selloff
Chart for EOS/USD (1W) Cryptocurrency markets plunge deep in the red, dancing to the tune of Bitcoin (BTC). Eos (EOS) investors are not moved by this confusion. In fact, as the above weekly chart for EOS/USD shows, the price of Eos (EOS) has not corrected the same way as the rest of the market. дальше »
2018-10-11 00:30 | |
|
|
No Bearish Breakdown? Is the Bitcoin Bear Market Coming to a Conclusion?
A breakout has still not occurred in Bitcoin as the triangle pattern approaches its end. On the logarithmic scale chart, price action has actually managed to break out of the pattern and close above, but this also happened earlier in the year and preceded a sharp decline. дальше »
2018-10-10 16:49 | |
|
|
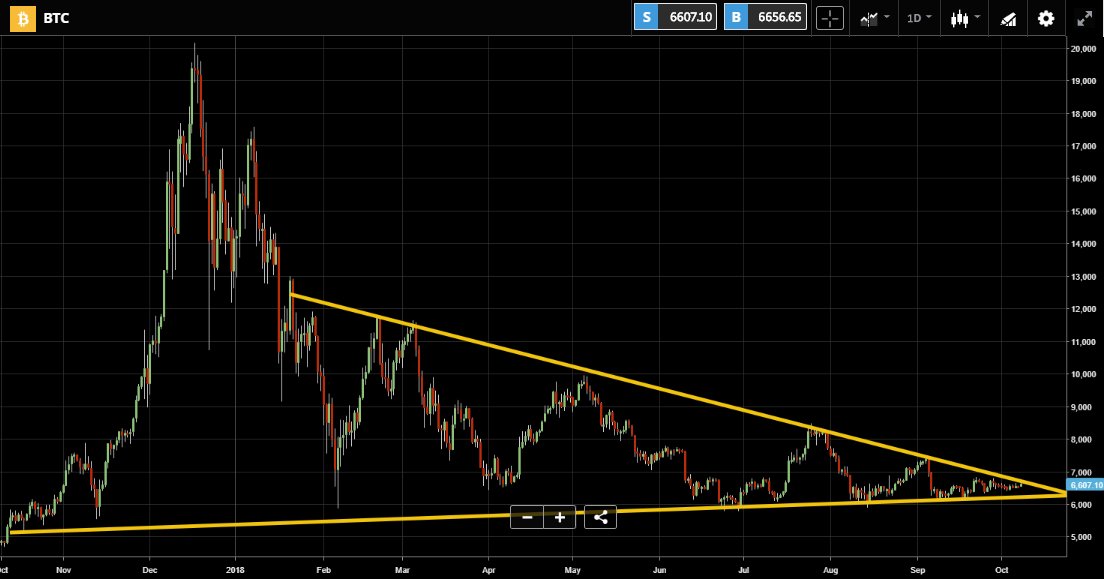
Bitcoin Price Update: Breakout Imminent as Price Looks to Move Beyond Descending Triangle
Bitcoin looks set for an imminent price breakout. The price action chart for the top-ranked cryptocurrency shows a classic breakout pattern which could potentially signal an end to the sideways trading of the last two months. дальше »
2018-10-8 19:45 | |
|
|
Bitcoin (BTC) Price Watch: Is That a Bullish Breakout Yet?
Bitcoin Price Key Highlights Bitcoin price appears to be closing above the top of its symmetrical triangle pattern to show that bulls are gaining the upper hand. If so, this could lead to a rally that’s roughly the same height as the formation, which spans $6,000 to $10,000. дальше »
2018-10-8 06:41 | |
|
|
Tron [TRX] up 8.26%, Among Today’s Top Large Cap Cryptocurrency Performers – Inverse Head & Shoulders Pattern in Play?
Tron is one of today top large-cap cryptocurrency performers with only Bitcoin Private and Noah Coin above it on CoinMarketCap’s top 100 Market Capitalization. Tron is currently up 8. 26% for the day according to TradingView and looks to be building an inverse head and shoulders pattern. дальше »
2018-10-7 20:09 | |
|
|
Bitcoin (BTC) Price Watch: Ready for a Long-Term Breakout?
Bitcoin Price Key Highlights Bitcoin is now at the very end of its long-term triangle consolidation pattern, so a breakout could happen anytime soon. Price is currently testing the resistance around $6,600 and a long green candle closing above this could be enough to signal further gains. дальше »
2018-10-4 07:05 | |
|
|
Ripple Price Analysis: XRP/USD Bullish Above $0.5520
Key Highlights Ripple price is holding the $0. 5500 and $0. 5520 support levels against the US dollar. There is a major breakout pattern formed with resistance at $0. 5820 on the hourly chart of the XRP/USD pair (data source from Kraken). дальше »
2018-10-2 10:30 | |
|
|
Bitcoin Price Analysis: Failure of Buyers to Close Above $7,000 is Bearish for BTC
After three weeks of bulls, Bitcoin prices are yet to breach the $6,800–$7,200 main resistance zone. With this, bears are in control as Sep 5 bearish pattern overshadow buy attempts. Remember, this is printing at the time when investors, market influencers and traders are “over the top bullish”. дальше »
2018-10-2 05:00 | |
|
|
Bitcoin (BTC) Compound Fulcrum And Correlation With Copper
Bitcoin (BTC) is printing a pattern which is a very rare sight in the world of technical analysis. This formation seen on the above daily chart for BTC/USD is called a compound fulcrum. It comprises of an inverse head and shoulders and a head and shoulders trading inside a wedge in the order visible above. дальше »
2018-9-28 17:00 | |
|
|
Bitcoin Cash Price Analysis: BCH/USD Dips Remain Supported Above $540
Key Points Bitcoin cash price extended gains above the $550 resistance and traded towards $600 against the US Dollar. There was a break above a bullish pennant pattern with resistance at $522 on the hourly chart of the BCH/USD pair (data feed from Kraken). дальше »
2018-9-28 07:28 | |
|
|
Bitcoin Price Watch: BTC/USD Could Correct Lower To $6,400
Key Points Bitcoin price traded further higher above the $6,450 and $6,510 resistances against the US Dollar. There is a short term ascending channel in place with support at $6,505 on the hourly chart of the BTC/USD pair (data feed from Kraken). дальше »
2018-9-14 11:48 | |
|
|
Ethereum (ETH) One Step Away From Kicking Off The Altcoin Rally
It is a rare sight in the crypto community to see Ethereum (ETH) in the green after a long queue of weeks in the red. The daily chart above for ETH/USD shows that Ethereum (ETH) is just a single step away from kicking off the altcoin rally. дальше »
2018-9-13 18:30 | |
|
|
Ripple (XRP) All Set To Lead Altcoin Rally By October
Ripple (XRP) is probably the most bullish looking coin right now. This is because Ripple (XRP) has already complete an almost 92% correction since its fall from $3. 31 in January this year. In addition to that, as the above weekly chart for XRP/USD shows, Ripple (XRP) has just completed a giant bullish gartley pattern that extends all the way to 2017. дальше »
2018-9-12 00:30 | |
|
|
Bitcoin Price Watch: BTC/USD Approaching Next Key Break
Key Points Bitcoin price is preparing for the next move with resistances near $6,385 and $6,530 against the US Dollar. Yesterday’s highlighted major breakout pattern is still active with resistance at $6,385 on the hourly chart of the BTC/USD pair (data feed from Kraken). дальше »
2018-9-11 11:48 | |
|
|
Bitcoin Price Watch: BTC/USD Remains At Risk Below $6,500
Key Points Bitcoin price is currently consolidating below a major resistance at $6,500 against the US Dollar. There is a short-term breakout pattern in place with resistance at $6,380 on the hourly chart of the BTC/USD pair (data feed from Kraken). дальше »
2018-9-10 11:48 | |
|
|

Bitcoin Price Analysis: Bull Breakout or Bearish Reversal?
Bitcoin is working hard to overtake the $7,300 mark. However, the holding aspect that has proven problematic. Bitcoin Price Market Overview Bitcoin continues to reject at $7,300 even though it has staged a few inspiring pops above the $7,300 resistance. дальше »
2018-9-4 13:00 | |
|
|
EOS (EOS) Is On A Bullish Spree Again, But Has It Completed Its Correction Yet?
EOS (EOS) is on a bullish spree again. In fact, EOS (EOS) is one of the first coins to surge as soon as there is any indication of a recovery. This behavior is what has kept EOS (EOS) in the top ten as an investors’ favorite despite being at the centre of debates regarding centralization and ownership. дальше »
2018-8-30 21:30 | |
|
|
Breaking: Bullish Bitcoin [BTC] Price Moves Back Above $7000
In yesterday’s post, we weighed up both the bullish and bearish case for the price of Bitcoin. There were many signs pointing to further upward movement and this has manifested in Bitcoin now trading above $7,000. дальше »
2018-8-28 16:50 | |
|
|
Bitcoin Price Watch: BTC/USD Forming Breakout Pattern Above $6,600
Key Points Bitcoin price is trading in a contracting range with support above the $6,600 level against the US Dollar. There is a major contracting triangle in place with resistance around $6,740 level on the hourly chart of the BTC/USD pair (data feed from Kraken). дальше »
2018-8-28 11:48 | |
|
|
Bitcoin (BTC): An Interest Rate Hike In September Might Delay A Trend Reversal
Bitcoin (BTC) is about to complete a 69. 81% correction just as it did back in October 2014. What remains to be seen now is whether Bitcoin (BTC) will follow the exact same pattern as in 2014 or trade differently. дальше »
2018-8-26 18:30 | |
|
|
Ethereum Classic (ETC): The Diamond You Didn’t Know Existed
Ethereum Classic (ETC) has long been hailed as a hidden diamond in some crypto circles. This time, the whole crypto community can literally see what it really meant. It is true that Ethereum Classic (ETC) is a rare diamond of a blockchain project, but that is not what we are talking about. дальше »
2018-8-25 21:30 | |
|
|
Bitcoin Price Watch: BTC/USD at Risk of Upside Break above $6,540
Key Points Bitcoin price mostly traded in a range above the $6,300 support area against the US Dollar. There is a crucial breakout triangle pattern formed with resistance near $6,540 on the hourly chart of the BTC/USD pair (data feed from Kraken). дальше »
2018-8-20 11:48 | |
|
|
Litecoin Price Analysis: LTC/USD Could Resume Its Decline
Litecoin price corrected higher above the $58. 00 level against the US Dollar. LTC/USD failed to break the $60. 00 resistance and is currently moving lower. Key Talking Points · Litecoin price failed to move above the $60. дальше »
2018-8-16 07:32 | |
|
|
Bitcoin (BTC) Fractal Analysis Shows Bots Still Dominate The Market
Bitcoin (BTC) has fallen sharply in the last 24 hours on news of the SEC delaying its decision regarding the VanEck/SolidX Bitcoin ETF till September. The 4H chart above for BTC/USD shows that while the news served as a catalyst for yesterday’s price action, Bitcoin (BTC) would have eventually followed the same pattern as major trading activity is still dominated by bots. дальше »
2018-8-9 21:30 | |
|
|
Bitcoin (BTC) Price Monthly: Will We End With Bullish Engulfing Pattern?
Our good friends over at Bitcoin Bravado just published their BTC Monthly and are looking at the trends showing in the picture above. As all of you bitcoin traders and crypto investors can see on the 1 minute chart above, the smaller red candle is overshadowed by the larger green candle as we approach the […] дальше »
2018-7-30 19:27 | |
|
|
Ethereum (ETH) Price Analysis: Short-Term Reversal Pattern
Ethereum broke above the neckline of a short-term double bottom to signal that an uptrend may be in the works. The post Ethereum (ETH) Price Analysis: Short-Term Reversal Pattern appeared first on Ethereum World News. дальше »
2018-7-25 09:58 | |
|
|
Tron (TRX) Price Watch: Small Reversal Pattern Sighted!
Tron Price Key Highlights Tron price could have another shot at a rally as it broke above the neckline of a short-term double bottom. Price is hitting resistance around 0. 0400 and may be due for a pullback before resuming the climb. дальше »
2018-7-25 07:12 | |
|
|
Cardano, Ethereum Classic, NEO, DASH, IOTA Technical Analysis July 24th
Alt-Coins Bull Trend Resumption Imminent Most of the coins under review as DASH, Ethereum Classic and NEO are struggling as they move within a trade range. While the general market sentiment is bullish, these coins are technically constrained within a bear break out pattern. дальше »
2018-7-24 19:35 | |
|
|

Bitcoin price analysis for this week: BTC/USD’s next target $8500
Bitcoin price is placed nicely in an uptrend above $7,000 against the US Dollar. Bitcoin Price Range Pattern This past week, there was a major upside move above the $6,800 resistance in bitcoin price against the US Dollar. дальше »
2018-7-22 16:22 | |
|
|
Ripple (XRP): Striking Similarities Between 2017 And 2018 Fractals
Ripple (XRP) makes all the gains for a whole cycle in a month’s time. In other words, the price corrects for the rest of the year as some investors take profit and others panic sell. While this may seem like a farfetched theory, it is surprising to see how Ripple (XRP) follows the exact same pattern over and over again as demonstrated by the chart for XRP/BTC above. дальше »
2018-7-19 18:00 | |
|
|
Ethereum (ETH) Price Analysis: Reversal Pattern Confirmation
Ethereum is closing above the neckline of its double bottom reversal pattern to indicate that an uptrend is underway. The post Ethereum (ETH) Price Analysis: Reversal Pattern Confirmation appeared first on Ethereum World News. дальше »
2018-7-18 08:48 | |
|
|
Bitcoin (BTC) Price Watch: Bullish Pattern Confirmation!
Bitcoin Price Key Highlights Bitcoin price finally broke above the neckline of its inverse head and shoulders pattern to signal that a rally is underway. The chart pattern is around $1,000 tall so the uptrend has room to go, but a pullback might take place. дальше »
2018-7-18 07:09 | |
|
|
Bitcoin (BTC) Price Watch: Down But Not Out!
Bitcoin Price Key Highlights Bitcoin price appears to be keeping its head above the near-term area of interest at the channel support. If a bounce back to the resistance happens, an inverse head and shoulders pattern could also be completed. дальше »
2018-7-16 06:57 | |
|
|

Bitcoin Price Analysis: Breach Below Trading Range May Spark Spring Retest
After a feeble rally on diminishing volume, bitcoin is currently in the middle of its first major pullback in about 2 weeks. Over the last week or so, bitcoin managed to break its sustained downtrend and trend back inside the macro trading range (TR) — both of which are quite bullish market characteristics. дальше »
2018-7-11 00:21 | |
|
|
Bitcoin Price Watch: BTC/USD in Clear Uptrend
Key Points Bitcoin price extended gains and broke the $6,400 resistance zone against the US Dollar. Yesterday’s discussed bullish flag pattern was breached with resistance at $6,380 on the hourly chart of the BTC/USD pair (data feed from Kraken). дальше »
2018-7-3 11:28 | |
|
|
Bitcoin (BTC) Price Watch: Another Bullish Continuation Signal
Bitcoin Price Key Highlights Bitcoin price has broken above the double bottom neckline and bullish flag to signal upside momentum. Price is forming another bullish flag pattern, which might signal a continuation of the climb. дальше »
2018-7-3 07:25 | |
|
|
Bitcoin Price Watch: BTC/USD Forming Bull Flag
Key Points Bitcoin price remained well supported above the $6,200 support area against the US Dollar. There is a bullish flag pattern forming with support at $6,260 on the hourly chart of the BTC/USD pair (data feed from Kraken). дальше »
2018-7-2 11:38 | |
|
|