2018-10-8 19:45 |
Bitcoin looks set for an imminent price breakout. The price action chart for the top-ranked cryptocurrency shows a classic breakout pattern which could potentially signal an end to the sideways trading of the last two months.
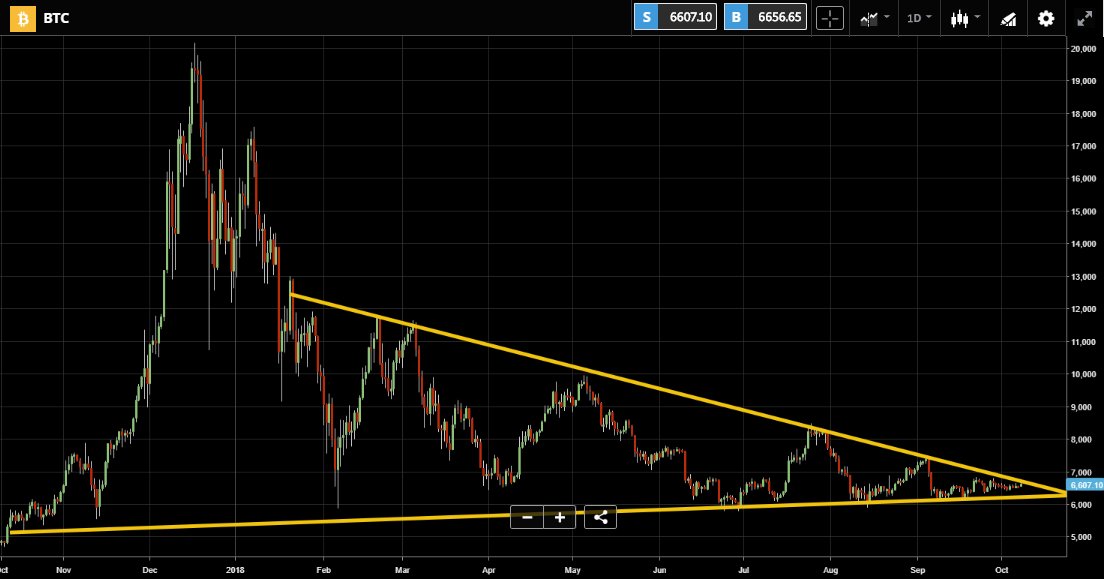
Many Signs Pointing to a Bitcoin BreakoutLooking at the price chart above, Bitcoin seems sure to break the descending triangle which usually means a breakout is imminent. Since rallying to $8,400 in late July, the top-ranked cryptocurrency has traded in tight ranges.
During this period, BTC has set successive lower monthly highs and higher monthly lows. Such is the extent of the volatility contraction that BTC is now at its lowest price volatility level in 17 months.
In a tweet posted on Monday (October 8, 2018), Mati Greenspan of eToro offered some expert insight on the current BTC price action, saying:
This is a classic breakout pattern. As you can see the range (defined by the yellow lines) is getting narrower and has reached the tip. The price will now break out of the triangle. Usually, the direction of the breakout carries great significance.
The prolonged narrowing of Bitcoin’s volatility also brings another critical technical indicator – the Bollinger Bands (BB), into consideration. BTC is currently in what is called a ‘Bollinger Squeeze (BB squeeze).’ This happens when the upper and lower bands are close together as seen in the chart below.
On six previous occasions when the Bollinger bands for Bitcoin were in squeeze position, the price rallied by a significant amount. The last time this occurred was before the massive price pump that saw BTC set a new all-time high of $19,700 in mid-December.
Likely Upward Trajectory for Bitcoin PriceHowever, indicators aren’t enough to confidently assert that BTC is set for a breakout of significant magnitude. There is still the issue of liquidity which hasn’t improved in 2018. All these past breakouts have also included an increase in market capitalization in the order of two or more degrees of magnitude.
At present, with the bull fatigue among retail investors and the lack of enough volume on the institutional front, the expected breakout might not materialize as expected. However, judging by indicators alone, Bitcoin looks set for an upward price trajectory.
Such a move would be in keeping with the recent assertions of Spencer Bogart, Tom Lee, etc. It would also signal the start of the expected reaction to the slew of recent positive developments in the industry like Bakkt, Yale, etc.
Image courtesy of Twitter (@MatiGreenspan), and Tradingview.
Header image courtesy btcwallets.com.au.
The post Bitcoin Price Update: Breakout Imminent as Price Looks to Move Beyond Descending Triangle appeared first on Ethereum World News.
origin »Bitcoin price in Telegram @btc_price_every_hour
Breakout (BRK) на Currencies.ru
|
|