Новости о Indicators Pattern [ Фото новости ] [ Свежие новости ] | |

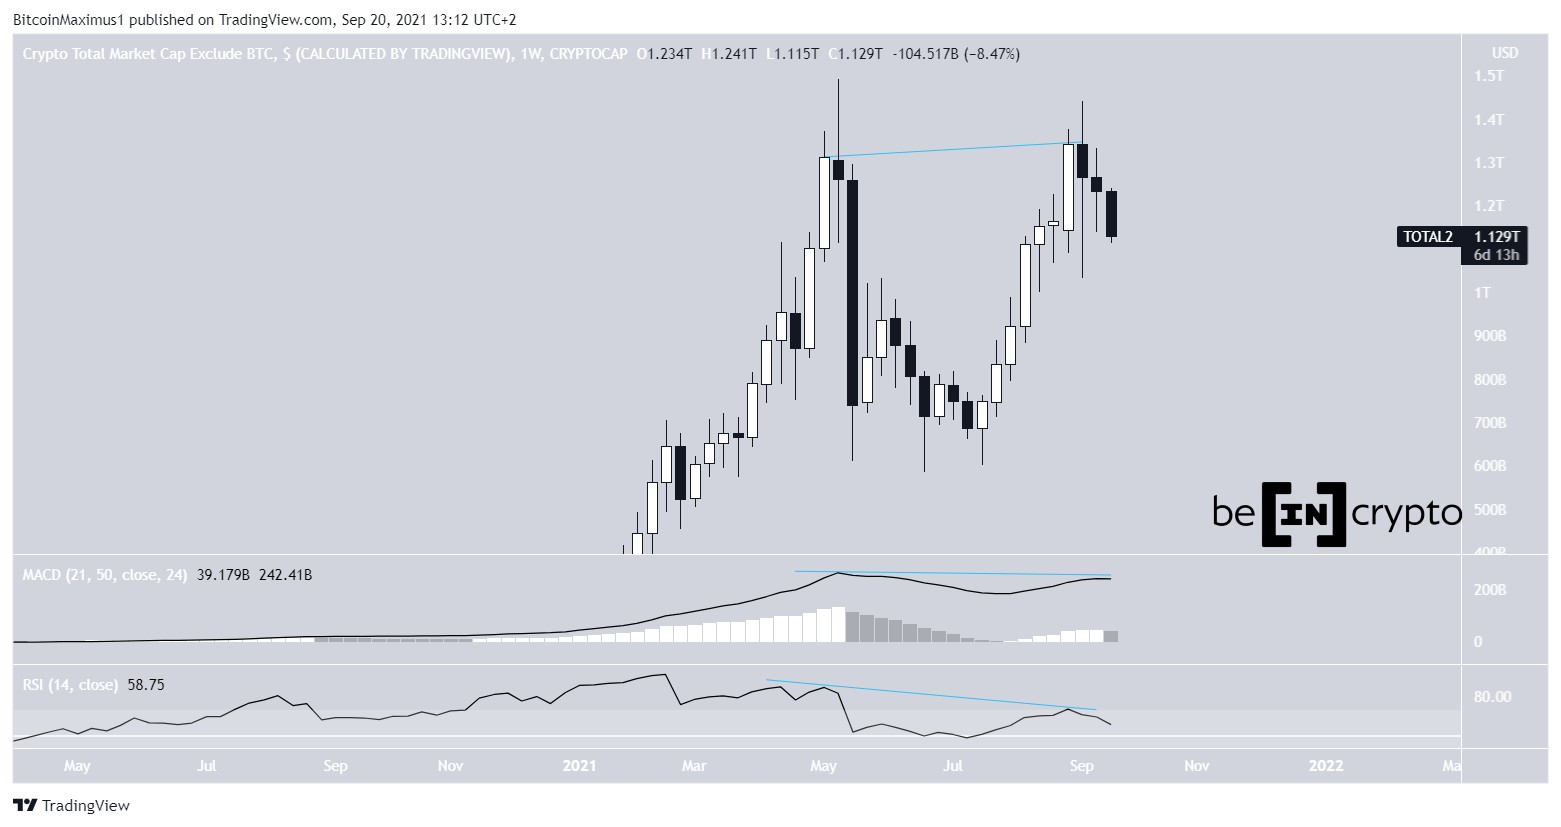
Altcoin Market Cap Scrambles for Support
The altcoin market cap (ALTCAP) has created a double top pattern close to its all-time high price. Technical indicators are bearish. The post Altcoin Market Cap Scrambles for Support appeared first on BeInCrypto. дальше »
2021-9-20 17:01 | |
|
|

XRP price will fall to new lows vs. Bitcoin if this famous chart pattern plays out
XRP price bulls watch out! The popular Head and Shoulder pattern is statistically among the most accurate trend indicators.
дальше »2021-6-25 13:04 | |
|
|

If this historic pattern plays out, Bitcoin will smash $300k in no time
Historically bullish patterns have been trailing the Bitcoin market scene, signaling a potential price pump to a new all-time high. Like many other indicators, a bullish pattern has once again been spotted. дальше »
2021-3-12 20:41 | |
|
|
SUSHI, MATIC and STX: Technical Analysis for February 25
While Matic Network (MATIC) is nearing an all-time high price, it potentially creates a double top pattern, and technical indicators show weakness. Similarly, BlockStack seems to be in the final portion of its upward move, despite no clear weakness yet from technical indicators. дальше »
2021-2-26 18:01 | |
|
|
Bitcoin taps support at $33k, hints at a near-term upside breakout
Bitcoin has been recording losses for the past few days. The big bull shredded about $13,000 of its price, a bear pattern that was last seen in October of last year. Indicators are now hinting that the bear market is taking control and that the dips are expected to become even more intense. But this […] дальше »
2021-1-25 12:50 | |
|
|
VeChain (VET) Bounces Up and Aims for Nearest Resistance
Despite the corrective short-term pattern that VeChain has been trading in, technical indicators are bullish and support the possibility that the upward movement will continue. VeChain Re-Tests Support The VET price has been moving upwards since Nov. дальше »
2020-12-1 15:09 | |
|
|
Bitcoin Wave Count Suggest One Final Upward Move
The Bitcoin (BTC) price is nearing the top of a bullish impulse that has been transpiring since the beginning of March. Technical indicators suggest that BTC may make at least one more upward move to complete the pattern before reaching a top. дальше »
2020-11-10 13:41 | |
|
|
Bitcoin (BTC) Double-Top Could Lead to a Short-Term Retracement
The Bitcoin (BTC) price has increased significantly over the past two weeks but has created a bearish pattern in the short-term. Technical indicators are also showing weakness, indicating a retracement could be in the cards. дальше »
2020-11-2 13:21 | |
|
|
Bitcoin Briefly Breaks Out Above $11,000 but Cannot Sustain Higher Prices
The Bitcoin (BTC) price reached a high above $11,100, purportedly breaking out from the current pattern, but was rejected by an important Fib level and has been decreasing since. Bitcoin Rejected At Resistance Technical indicators have begun to move upwards, but have not confirmed a reversal yet. дальше »
2020-9-17 16:55 | |
|
|

IOTA Attempts to Break Through Long-Term Resistance
The IOTA (IOTA) price is trading inside a long-term resistance area, a breakout above which could trigger a rapid increase. However, the price has fallen into a bearish pattern, and technical indicators are showing weakness, making a rejection much more likely. дальше »
2020-7-11 09:56 | |
|
|
Will LINK Reach a New All-Time High Or Will It Break Down?
The Chainlink (LINK) price is very close to reaching an all-time high. However, technical indicators show considerable weakness, putting doubt in the possibility of a breakout. LINK/BTC The LINK price is currently trading inside a very strong resistance area at 54,000 satoshis, inside which it has formed a triple top pattern. дальше »
2020-7-7 21:00 | |
|
|

Converging Bitcoin Indicators See Price Stagnant at $8,000s Until Sept 2020
Risks of Bitcoin price moving towards $8,2000 in the next quarter are growing, per two historically accurate technical indicators. The benchmark cryptocurrency has been trending downwards in a Falling Wedge pattern since June 2020. дальше »
2020-6-29 11:07 | |
|
|

Bitcoin Will Paint a Super Bullish Golden Cross Right After Halving
Bitcoin could form a Golden Cross pattern in the third or fourth week of May. The bullish signal will surface immediately after the cryptocurrency’s mining reward halving. The converging indicators could result in a massive upside shift. дальше »
2020-5-7 13:56 | |
|
|
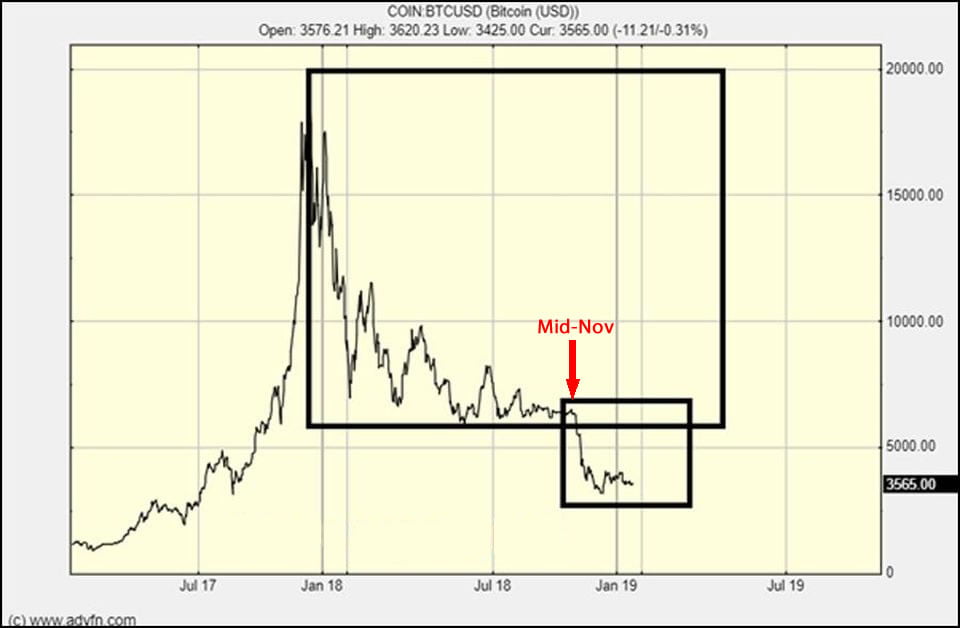
Sub-$7000 Bitcoin Price Bloodbath Could Spiral Near $4,000, Warns Analyst
A prominent analyst weighs on a head-and-shoulders pattern that could take bitcoin to $4,000 while several indicators add credibility to it. The post Sub-$7000 Bitcoin Price Bloodbath Could Spiral Near $4,000, Warns Analyst appeared first on CCN.com дальше »
2019-11-25 13:39 | |
|
|
Cardano set to breach falling wedge pattern, pushing price upward
The altcoin touched its six-month low in the first week of October plunging its prices to $0. 0378. At press time ADA was trading at $0. 0407, registering a fall of 1. 05% on the 24-hour price chart. дальше »
2019-10-12 15:42 | |
|
|
Bitcoin Could Break Down From a Descending Triangle, Warns Analyst
Chart patterns are used in technical analysis to limit the scope of possible price movement. Additionally, the type of pattern created often indicates the direction of the decisive move that breaks the pattern. дальше »
2019-10-5 19:15 | |
|
|

Bitcoin drops 15%, indicators show potential for decline to $6,500
In the last three hours, the BTC price dropped 15 percent breaking out to the downside of a technical pattern that predicts a further decline to $6,500. The drop coincides with a Bitcoin hashrate drop of over 30 percent and a ruling on the Bitfinex Tether investigation. дальше »
2019-9-25 00:14 | |
|
|
Ethereum’s price approaches breach of Head & Shoulder pattern as bullish sentiments re-surface
After treading bearish sentiments for the past couple of months, Ethereum’s valuation indicated a break away from the bears at press time. In the last 11 days, Ethereum’s price registered a growth of over 10 percent in the charts. дальше »
2019-9-9 17:30 | |
|
|
XRP’s break from ascending triangle pattern is a sign of green pastures
If I got an XRP each time someone asked me about the price, I might have become a successful hodler! Addressing the elephant in the room -the question of XRP’s price swings in short-term; surprisingly the grass is green on this side of the coin as key indicators point towards a trend reversal. дальше »
2019-8-31 16:00 | |
|
|
XRP forms symmetrical triangle pattern but MA indicators complete bearish crossover
2019 was deemed as a positive year for virtual assets as a majority of the crypto experienced a positive hike; XRP surged in the market as well which took its valuation from $0. 300 to $0. 475, registering a growth of over 58 percent. дальше »
2019-8-26 14:09 | |
|
|

Another Slump For Bitcoin As Bear Market Indicators Loom
Bitcoin’s range bound pumps and dumps have become commonplace over the past six weeks. Another slide a few hours ago should not be cause for alarm then as BTC failed to register further gains. It is now in danger of heading back into four figures for the fifth time. дальше »
2019-8-21 11:03 | |
|
|

Bitcoin Price Analysis: Rising Wedge Could Drive BTC to $8.8K
Bitcoin can be seen bouncing off the 0. 382 Fibonacci level around $9,600 as price action visibly creates an ascending wedge. Many bearish indicators point towards a break-down and lower low in the coming days. дальше »
2019-8-20 16:28 | |
|
|
Bitcoin Price Analysis BTC / USD: What Goes Up….
Bitcoin has a neutral short-term bias, with the cryptocurrency testing towards its 200-period moving average on the four-hour time frame The four-hour time frame shows a bearish head and shoulders pattern Technical indicators on the daily time frame are starting to correct from overbought readings Bitcoin / USD Short-term price analysis Bitcoin has a neutral […] The post Bitcoin Price Analysis BTC / USD: What Goes Up…. appeared first on Crypto Briefing. дальше »
2019-7-2 15:41 | |
|
|
Bitcoin Price Analysis BTC / USD: $13,000 Rat Poison
Bitcoin has a bullish short-term bias, with the cryptocurrency trading at its highest level since January 2018 Technical indicators on the four-hour time frame show that the BTC / USD pair is extremely overbought The daily time frame shows that bulls have now triggered a huge inverted head and shoulders pattern Bitcoin / USD Short-term […] The post Bitcoin Price Analysis BTC / USD: $13,000 Rat Poison appeared first on Crypto Briefing. дальше »
2019-6-27 17:06 | |
|
|
Bitcoin Price Analysis: Two Bullish Indicators Are Flashing at $8K
Bitcoin price analysis shows that bullish momentum is building as BTC reclaims the psychological $8K level. But is a new YTD-high next? Bitcoin Price Analysis: Daily Chart Bitcoin’s price continues to track nicely inside an ascending triangle pattern, after bulls successfully springboarded off the $7,500 level yesterday. дальше »
2019-5-24 16:00 | |
|
|
Fractal Pattern Analysis Indicates Bitcoin Could Fall to $2,500 Before Recovery
Chart and pattern analysis has been widely used to try to predict when Bitcoin and crypto markets will hit the bottom. A huge range of technical indicators combined with historical snapshots are put to work in order to tell us when the optimum time to get back in is. дальше »
2019-1-24 12:00 | |
|
|
Ripple (XRP) Price Watch: Inverted Head and Shoulders
Ripple Price Key Highlights Ripple might be done with its slide as it forms an inverted head and shoulders reversal pattern on its 4-hour chart. A break above the neckline could confirm that an uptrend of the same height as the chart formation might be in the works. дальше »
2018-10-25 10:00 | |
|
|
Ethereum Classic (ETC) Can Easily End The Year Above $100
Ethereum Classic (ETC) is highly likely to trade north of $100 by end of the year. This does not require a very bullish Bitcoin (BTC). In fact, if Bitcoin (BTC) trades around $10,000, that would do the job for Ethereum Classic (ETC). дальше »
2018-10-12 17:30 | |
|
|
Bitcoin (BTC) Price Watch: Is That a Bullish Breakout Yet?
Bitcoin Price Key Highlights Bitcoin price appears to be closing above the top of its symmetrical triangle pattern to show that bulls are gaining the upper hand. If so, this could lead to a rally that’s roughly the same height as the formation, which spans $6,000 to $10,000. дальше »
2018-10-8 06:41 | |
|
|
Bitcoin (BTC) Price Watch: Ready for a Long-Term Breakout?
Bitcoin Price Key Highlights Bitcoin is now at the very end of its long-term triangle consolidation pattern, so a breakout could happen anytime soon. Price is currently testing the resistance around $6,600 and a long green candle closing above this could be enough to signal further gains. дальше »
2018-10-4 07:05 | |
|
|
Bitcoin (BTC) Price Watch: Still Stuck in Consolidation, Breakout Soon?
Bitcoin Price Key Highlights Bitcoin price is still stuck inside its triangle consolidation pattern on the 1-hour time frame. Price is nearing the peak of its formation so a breakout could take place soon. дальше »
2018-10-2 07:12 | |
|
|
Bitcoin (BTC) Price Watch: Bullish Breakout Alert!
Bitcoin Price Key Highlights Bitcoin price recently formed lower highs and higher lows to consolidate in a symmetrical triangle. Price appears to have completed an upside breakout, signaling that more gains are underway. дальше »
2018-9-28 07:20 | |
|
|
Bitcoin (BTC) Price Watch: Back to Support Yet Again!
Bitcoin Price Key Highlights Bitcoin price has formed higher lows and lower highs to trade inside a triangle pattern on its 4-hour time frame. Price got rejected on a test of resistance once more and a move to support appears to be taking place. дальше »
2018-9-25 07:34 | |
|
|
Bitcoin (BTC) Price Watch: Reversal Pattern Confirmation on SEC Order
Bitcoin Price Key Highlights Bitcoin price looks ready to confirm its double bottom reversal formation as it tests the neckline. A break higher could lead to a rally that’s the same height as the chart formation, which spans $6,100 to $6,650. дальше »
2018-9-21 07:16 | |
|
|
Bitcoin (BTC) Price Watch: Volatility Picking Up Leading to Bitcoin ETF SEC Ruling
Bitcoin Price Key Highlights Bitcoin price tossed and turned around current support levels but is still on track to complete a double bottom pattern. Price is making its way closer to the neckline around the $6,600 level and a break higher could confirm an uptrend. дальше »
2018-9-20 07:44 | |
|
|
Bitcoin (BTC) Price Watch: Bearish Wedge Breakout
Bitcoin Price Key Highlights Bitcoin price recently broke below a rising wedge pattern to signal that further losses are in the cards. Price might still pull back to the broken support area, which lines up with Fib levels, to gather more selling pressure. дальше »
2018-9-18 06:52 | |
|
|
Bitcoin (BTC) Price Watch: Bullish Reversal Pattern Forming?
Bitcoin Price Key Highlights Bitcoin price appears to be gaining some traction off its recent bounce, possibly forming another double bottom. This is a classic reversal formation, so a rally could be due once price breaks past the $7,400 neckline. дальше »
2018-9-17 06:35 | |
|
|
Bitcoin (BTC) Price Watch: Will Resistance Hold or Fold?
Bitcoin Price Key Highlights Bitcoin price has been on a steady climb recently and is closing in on a nearby resistance level. Price is still trading inside a falling wedge pattern on its daily chart and is about to test resistance around $7,500. дальше »
2018-9-5 06:58 | |
|
|
Bitcoin (BTC) Price Watch: Look Out for a Wedge Breakout
Bitcoin Price Key Highlights Bitcoin price is consolidating inside a rising wedge and is nearing the peak of the pattern. Price could break out of the formation anytime soon, signaling which direction a longer-term move might go. дальше »
2018-8-27 06:53 | |
|
|
Bitcoin (BTC) Price Watch: Waiting for a Triangle Breakout
Bitcoin Price Key Highlights Bitcoin price has formed higher lows and found resistance around $6,500 to create an ascending triangle pattern on its 1-hour chart. Price is currently testing the resistance and is nearing the peak of the formation, so a breakout might be due soon. дальше »
2018-8-20 07:38 | |
|
|
Bitcoin (BTC) Price Watch: Could This Be a Reversal Pattern?
Bitcoin Price Key Highlights Bitcoin price appears to be forming an inverse head and shoulders pattern on its 1-hour time frame. This is considered a classic reversal signal and if confirmed, price could pull up from its earlier drop. дальше »
2018-8-17 07:36 | |
|
|
Tron (TRX) Price Watch: Which Way Will It Break Out?
Tron Price Key Highlights Tron has formed lower highs and higher lows to create a symmetrical triangle pattern. Price just bounced off the top and may be due for a test of support soon. Technical indicators suggest that there’s a chance for support to break and lead to a selloff. дальше »
2018-7-27 09:02 | |
|
|
Bitcoin Cash (BCH) Price Watch: Ready for Uptrend Confirmation?
Bitcoin Cash Price Key Highlights Bitcoin Cash also formed a double bottom reversal pattern and appears to be inching past the neckline. In that case, this could confirm that bulls are back in the game and ready to take price much higher from here. дальше »
2018-7-18 07:28 | |
|
|
Bitcoin (BTC) Price Watch: Bullish Pattern Confirmation!
Bitcoin Price Key Highlights Bitcoin price finally broke above the neckline of its inverse head and shoulders pattern to signal that a rally is underway. The chart pattern is around $1,000 tall so the uptrend has room to go, but a pullback might take place. дальше »
2018-7-18 07:09 | |
|
|
Bitcoin (BTC) Price Watch: Waiting for Reversal Confirmation
Bitcoin Price Key Highlights Bitcoin price has completed its inverse head and shoulders reversal pattern and is now awaiting confirmation. Price is testing the neckline at $6,800 and an upside break could spur a $1,000 climb. дальше »
2018-7-17 07:21 | |
|
|

Bitcoin (BTC) Cost Observe: Rising Channel Underneath Major Support
Bitcoin Price Key Highlights Bitcoin price has formed higher lows and found resistance at the $6,785 level to create an ascending triangle. Price is testing the pattern’s resistance, which lines up with the broken long-term support visible on the 4-hour chart. дальше »
2018-7-9 11:13 | |
|
|