2021-7-31 00:06 |
Tomorrow is the last day of the month of July, and Bitcoin is at a pivotal moment in its lifetime. The crossroads of a possible bear market or bullish continuation is here, and the path chosen will dictate the trend for potentially months or years to come.
The monthly timeframe could provide clues as to what might be next, and we’ve got five ultra bullish technical charts and reasons why Bitcoin is more likely to blast off than fall further from here.
Critical Monthly Close Could Determine Crypto Cycle CrossroadsBitcoin is back at around $40,000 after a long drawn out and dramatic fall to $30,000. Each sweep below the support level was bought up, but resistance above also has yet to crack.
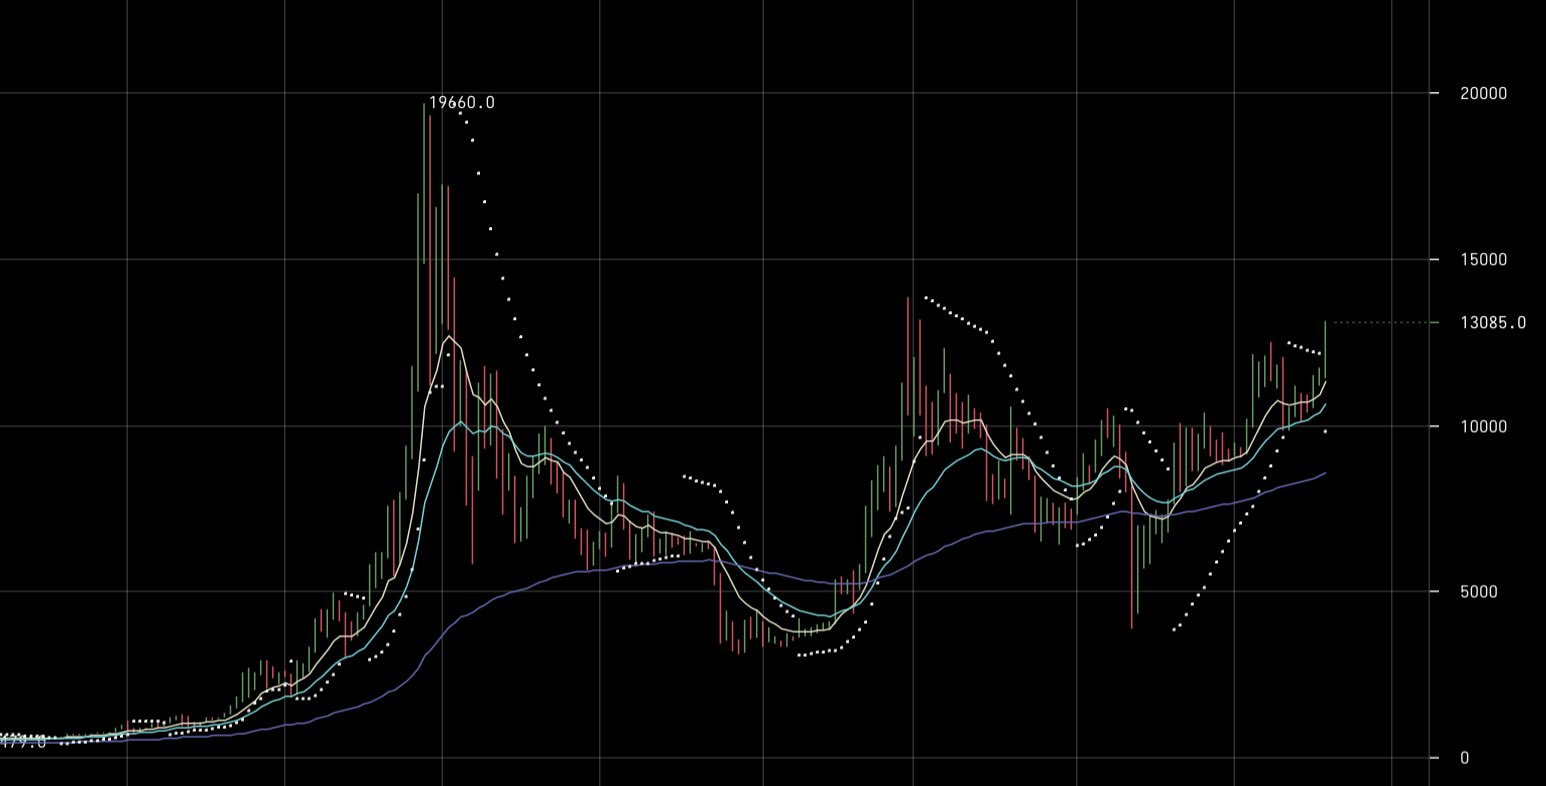
The reason for the stalemate between the two levels, is because price action on monthly timeframes is trapped between the Tenkan-sen and Kijun-sen. The last bear market was kicked off by losing such level. The monthly candle is also holding at support, which is something that failed to happen in early 2018.
The Ichimoku is currently bullish on the top cryptocurrency | Source: BTCUSD on TradingView.comThe two smaller bodied candles from June and July appear similar in structure as the pair that set the bear market bottom around $3,000 and has never yet been broken.
Related Reading | Ready To Run: Bitcoin Forms Best Performing Bull Market Bottoming Pattern
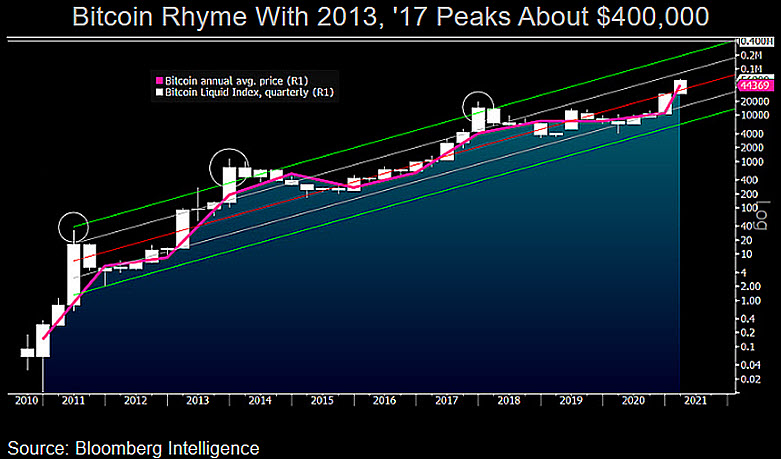
The Japanese candlestick pattern is also forming just as Bitcoin price brushes up against a long-term parabolic curve. A similar sized move up from the 2018 bottom might resembled the measured target from here.
Candle structure matches the bear market bottom | Source: BTCUSD on TradingView.comAlthough the below chart demonstrates the TD sequential indicator at a red 2-count, which would suggest any downtrend is in its early stages (compare to past counts for examples). But in bulls favor, support has fallen back to where a TD 9 count was previously broken on the high timeframe.
Support is holding where the trend became interesting | Source: BTCUSD on TradingView.com Bitcoin Bull Stampede Could Be Brewing, According To TechnicalsThe bullish signals on the monthly timeframe simply just don’t stop there. Bitcoin price has plenty more to suggest the bull run is nowhere yet finished.
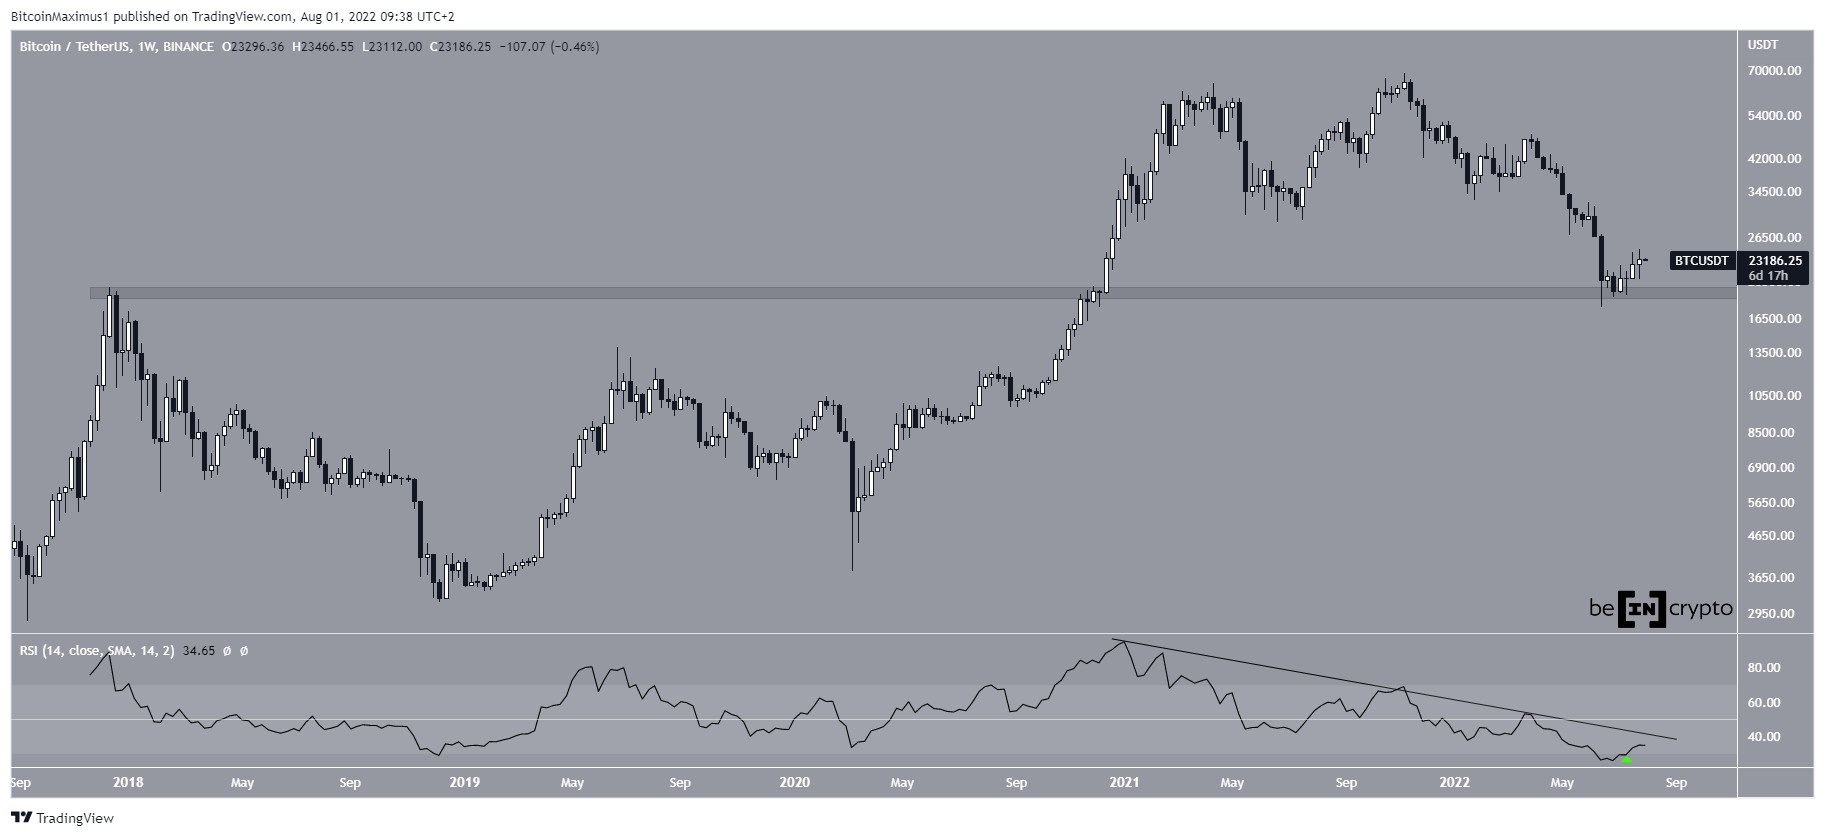
The next signal is from the Relative Strength Index, which suggests that although Bitcoin got overheated very quickly during this last impulse, the bull run would barely be a whimper compared to the last rally.
RSI support is holding | Source: BTCUSD on TradingView.comThe RSI is holding at a level that prompted that last major bull market of 2017, and has begun to turn back higher. If the same reading is taken from the point of support during the last bull market, the RSI suggests there’s a lot more room for bulls to run this cycle.
Related Reading | Bitcoin Indicator Forecast Calls For $46K, New All-Time Highs Possible
Finally, there’s the LMACD, which is narrowly escaping a bearish crossover.
There's no bearish crossover... yet | Source: BTCUSD on TradingView.comThe LMACD is the logarithmic version of the moving average convergence divergence indicator, and is better suited for use with Bitcoin. Past bear crosses on the monthly timeframe led to extended downtrends, while narrowly crossing in late 2020 led Bitcoin’s charge to $60,000 per coin.
All of the charts combined suggest that any bearish action on lower timeframes, was nothing more than a shakeout of epic proportions. However, only time will tell, and there is still more than 24 hours left before the clearly critical monthly candle comes to a dramatic close.
Follow @TonySpilotroBTC on Twitter or via the TonyTradesBTC Telegram. Content is educational and should not be considered investment advice.
Featured image from iStockPhoto, Charts from TradingView.com origin »Bitcoin price in Telegram @btc_price_every_hour
Bitcoin (BTC) на Currencies.ru
|
|