2021-3-25 19:37 |
The DeFi index has been decreasing since reaching a new all-time high on March 20.
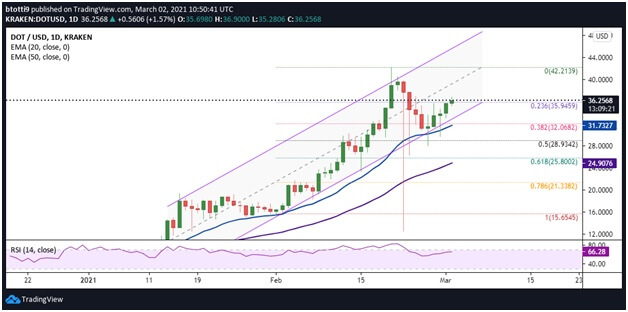
Uniswap (UNI) reached an all-time high price of $36.80 on March 23 but dropped sharply immediately afterward.
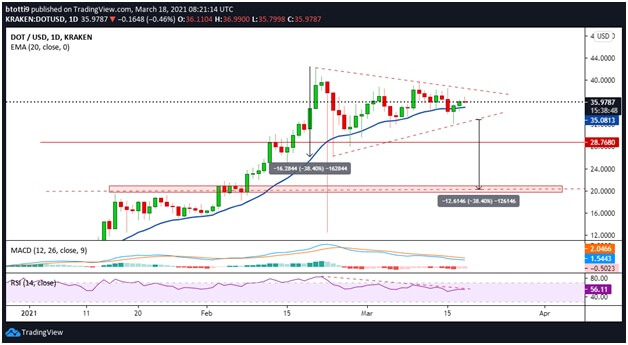
Polkadot (DOT) has been increasing since Feb. 23. However, it has failed to reach a new all-time high price.
Polkadot (DOT)After decreasing from its all-time high of $42.28 on Feb. 20, DOT bounced three days later and created a very long lower wick.
The bounce occurred right at the 0.5 Fib retracement level.
While DOT has been moving upwards since the increase looks corrective due to the significant overlap.
Technical indicators are bearish. The MACD is negative, and the RSI has fallen below 50. The Stochastic oscillator has made a bearish cross and is moving downwards.
It is possible that DOT is in the C-wave of an A-B-C corrective structure.
If so, it could decrease towards the 0.618 Fib retracement at $23.50. This would also give waves A:C a 1:1 ratio.
DOT Chart By TradingView Highlights Technical indicators in the daily time-frame are bearish. DOT could be in the C wave of an A-B-C corrective structure. UniSwap (UNI)UNI reached an all-time high of $36.80 on March 23 but dropped sharply immediately afterward.
It created a shooting star candlestick, which often leads to a bearish reversal. Furthermore, UNI has now decreased below the $32.80 area, which is likely to act as resistance.
Technical indicators in the daily time-frame are bearish.
The Stochastic oscillator has made a bearish cross. The MACD has crossed into negative territory. While the RSI is above 50, it is moving downwards.
Therefore, the most likely scenario would have the token dropping towards the $27.43 or $25.22 support area. These are the 0.5 & 0.618 Fib retracement levels, respectively.
The latter is also a horizontal support level, increasing its significance.
UNI Chart By TradingView Highlights There is resistance at $32.80.There is support at $27.43 & $25.22. DeFi IndexThe movement of the DeFi index is similar to that of UNI. After it reached an all-time high of $2786 on March 20, a drop followed.
This caused the price to drop below the $2580 area, which is now acting as resistance. Until the area is reclaimed, we cannot consider the trend bullish.
Technical indicators are undecided. While the MACD is decreasing, currently being negative, the RSI has generated hidden bullish divergence.
The Stochastic oscillator is decreasing, but has yet to make a bearish cross.
Furthermore, there is strong support at the $2250 level.
Therefore, the index may bounce near this level and make another attempt at reaching a new all-time high.
DEFI Chart By TradingView Highlights There is resistance at $2580.There is support at $2250.For BeInCrypto’s latest Bitcoin (BTC) analysis, click here.
The post DOT, UNI & the DeFi Index Reach New All-Time Highs appeared first on BeInCrypto.
origin »Bitcoin price in Telegram @btc_price_every_hour
Time New Bank (TNB) на Currencies.ru
|
|