DeFi Token Yearn.Finance (YFI) Breaks Massive Pattern Neckline, What’s Next?

2020-10-3 23:00

Yearn.Finance (YFI) has stolen the attention away from most other DeFi tokens, Ethereum, and Bitcoin thanks to an amazing run where tens of thousands per coin in value were added.

But the Ethereum-based ERC20 token has recently broken below and is now retesting the neckline of a massive head and shoulders pattern. If the altcoin falls deeper from here, confirming the pattern, it could soon find itself back being cheaper than Bitcoin once again.

DeFi Token YFI Falls Below Neckline Of Massive Head And Shoulders

The DeFi trend was already blazing hot by the time Yearn.Finance was introduced, but its release sent the bandwagon into overdrive.

Capital poured into the cryptocurrency market cap at incredible rates, particularly into the DeFi sector. Ethereum-based tokens fueling the future of decentralized finance applications such as lending, borrowing, yield farming, and more lifted the market from depths of Black Thursday.

Related Reading | Yearn.Finance (YFI) Could Fall To $15K “If” Bitcoin Brings Down Crypto

Along the way, Yearn.Finance exploded onto the scene, and thanks to an extremely limited 30,000 token supply, the outrageously volatile asset quickly ballooned to over $40,000 in value, making it at one point four times the value per Bitcoin.

YFI was for a while holding support, and analysts had claimed that as long as Bitcoin and other crypto assets played nice, Yearn.Finance would hold too.

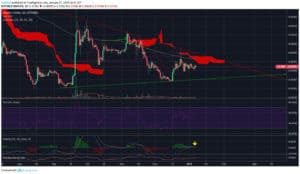
But Bitcoin plummeted at the news of BitMEX’s run in with the CFTC, and YFI has now lost the neckline of a massive head and shoulders pattern, that could send the token tumbling back down to early valuations just after launch.

YFIUSDT 4H Price Chart Head And Shoulders With Neckline Throwback and Retest | Source: TradingView Yearn.Finance Could Retest $10,000, Just Like Bitcoin

From the top of the structure to the bottom of the neckline was a 50% fall, dropping from over $40,000 to just over $20,000. According to the measure rule, the target of the formation would take Yearn.Finance back to $10,000 or potentially lower.

Head and shoulders are bearish reversal patterns that arrive at the top of an uptrend. And although YFI’s uptrend was extremely short-lived, prices grew to astronomical levels quickly.

Related Reading | Yearn.Finance (YFI) Flies 15% Percent From Local Price Floor, Fractal Targets $60K+

And now that risk and fear have returned to the cryptocurrency market, YFI valuations are coming back down to reality.

However, there’s always a chance that YFI reclaims the neckline, and tries for higher. If that happens, a fractal that could send the asset to $60,000 could be back on, and a fall to Bitcoin comparable prices will be narrowly avoided by just a neck.

Featured image from Deposit Photos, Charts from TradingView

Similar to Notcoin - TapSwap on Solana Airdrops In 2024

origin »

yearn.finance (YFI) на Currencies.ru

$ 0 (+0.00%)
Объем 24H $0
Изменеия 24h: 0.00 %, 7d: 0.00 %
Cегодня L: $0 - H: $6229.77
Капитализация $0 Rank 99999
Цена в час новости $ 21233.28 (-100%)

neckline pattern defi massive token finance yearn

neckline pattern → Результатов: 41


Ravencoin Price Analysis RVN / USD: Flight Fatigue

Ravencoin is currently bullish over the short-term and bearish over the medium-term The four-hour time shows that a bullish ascending triangle pattern has now formed The RVN / USD pair has been rejected from the neckline of a head and shoulders on the daily time frame Ravencoin has undergone a bearish reversal after rallying to […] The post Ravencoin Price Analysis RVN / USD: Flight Fatigue appeared first on Crypto Briefing.

2019-10-11 16:50


Nano Price Analysis NANO / USD: Healing Its Wounds

Nano has a bullish short-term outlook, with the NANO / USD pair moving back above key technical resistance on the four-hour time frame The four-hour time frame shows that a bullish inverted head and shoulders pattern is forming The daily time frame shows that buyers have move price above the neckline of a head and […] The post Nano Price Analysis NANO / USD: Healing Its Wounds appeared first on Crypto Briefing.

2019-7-26 16:22


Litecoin Price Analysis LTC / USD: Bounce Back

Litecoin has a bearish short-term bias, with the LTC / USD pair still undergoing a major downside breakout The four-hour time frame shows that bulls are testing back towards the neckline of a bearish head and shoulders pattern The daily time frame highlights a strong technical bounce from the LTC / USD pair’s 200-day moving […] The post Litecoin Price Analysis LTC / USD: Bounce Back appeared first on Crypto Briefing.

2019-7-18 18:24


Ren Price Analysis REN / BTC: Return Of The Bulls

Ren has an increasingly bullish short-term trading bias against Bitcoin The four-hour time frame shows that the REN / BTC pair has performing a bullish breakout from a falling wedge pattern The daily time frame shows that the REN / BTC is recovering back above the neckline of a bullish inverted head and shoulders pattern […] The post Ren Price Analysis REN / BTC: Return Of The Bulls appeared first on Crypto Briefing.

2019-7-6 16:30


Zcash Price Analysis ZEC / USD: Promising Privacy To The World

Zcash has a bullish short-term trading bias, with the cryptocurrency bouncing sharply from key technical support The four-hour time frame highlights that momentum has shifted to the upside The daily time frame shows that the ZEC / USD pair is consolidating above the neckline of a large bullish pattern Fundamental Analysis Zcash has shown a […] The post Zcash Price Analysis ZEC / USD: Promising Privacy To The World appeared first on Crypto Briefing.

2019-6-29 16:56


Tezos Price Analysis XTZ / USD: Turbulent Climb

Tezos has a bearish short-term bias, with the XTZ / USD pair trading below its 200-period moving average on the four-hour time frame The four-hour time frame continues to show a bearish head and shoulders pattern The daily time frame shows that price is testing the neckline of a large inverted head and shoulders pattern […] The post Tezos Price Analysis XTZ / USD: Turbulent Climb appeared first on Crypto Briefing.

2019-6-7 16:20


Ethereum Price Analysis ETH / USD: Landing With A Parachute

Ethereum has a neutral short-term trading bias, with the ETH / USD pair approaching its 200-period moving average on the four-hour time frame The four-hour time frame is currently showing a valid head and shoulders pattern The ETH / USD pair has now moved below key neckline support on the daily time frame Ethereum / […] The post Ethereum Price Analysis ETH / USD: Landing With A Parachute appeared first on Crypto Briefing.

2019-6-6 16:28


EOS Price Analysis EOS / USD: Whatevs

EOS has a bullish short-term outlook, with the cryptocurrency recently posting a fresh 2019 trading high The four-hour time frame shows that the bullish inverted head and shoulders pattern has reached its full upside projection The daily time frame shows that price is now moving back towards neckline support EOS / USD Short-term price analysis […] The post EOS Price Analysis EOS / USD: Whatevs appeared first on Crypto Briefing.

2019-6-3 17:08


ICX / USD Price Analysis: Important Test

ICON retains a bullish short-term outlook, with the cryptocurrency still trading above its 200-period moving average on the four-hour time frame The four-hour time frame also shows price pressing towards the neckline of bullish inverted head and shoulders pattern The medium-term time frame is neutral, with the ICX / USD pair trading at the top […] The post ICX / USD Price Analysis: Important Test appeared first on Crypto Briefing.

2019-4-23 16:35


Фото:

XRP Price Analysis: Ripple Under Immediate Selling Pressure

XRP USD Short-term price analysis Ripple price under immediate selling pressure below $0.34 level. Early week decline has sent the XRPUSD pair below $0.3188 and to a fresh 2019 trading low Price trades below the neckline of a bearish head and shoulder pattern, August 2018 low may soon come into focus In the short-term, the […] The post XRP Price Analysis: Ripple Under Immediate Selling Pressure appeared first on Crypto Briefing.

2019-1-21 17:59


Фото:

Bitcoin Price Analysis: Range-Bound Market Coiled for Next Move

For the better part of a month and a half, bitcoin has been fairly range-bound and unable to establish new lows or new highs. There are some bullish and bearish setups on the horizon for bitcoin, so let’s check out both sides of the argument because currently the market is sitting in the middle of Indecisionville — the most immediate sign of which is this glaringly obvious head-and-shoulders bottom reversal pattern:Figure 1: BTC-USD, Daily Candles, Head-and-Shoulders BottomThis current pattern is nothing more than a setup at the moment, but it represents one potential outcome of this sustained consolidation.

2019-1-4 02:22